
Page 184 - Mechanical Behavior of Materials
P. 184
Problems and Questions 185
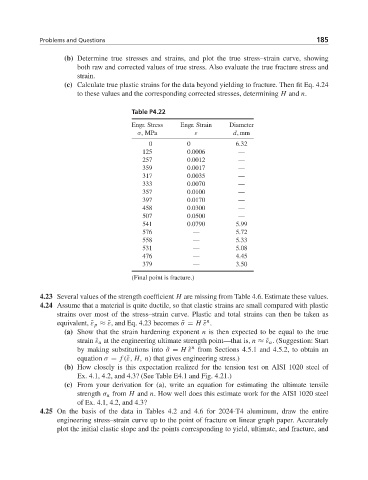
(b) Determine true stresses and strains, and plot the true stress–strain curve, showing
both raw and corrected values of true stress. Also evaluate the true fracture stress and
strain.
(c) Calculate true plastic strains for the data beyond yielding to fracture. Then fit Eq. 4.24
to these values and the corresponding corrected stresses, determining H and n.
Table P4.22
Engr. Stress Engr. Strain Diameter
σ, MPa ε d,mm
0 0 6.32
125 0.0006 —
257 0.0012 —
359 0.0017 —
317 0.0035 —
333 0.0070 —
357 0.0100 —
397 0.0170 —
458 0.0300 —
507 0.0500 —
541 0.0790 5.99
576 — 5.72
558 — 5.33
531 — 5.08
476 — 4.45
379 — 3.50
(Final point is fracture.)
4.23 Several values of the strength coefficient H are missing from Table 4.6. Estimate these values.
4.24 Assume that a material is quite ductile, so that elastic strains are small compared with plastic
strains over most of the stress–strain curve. Plastic and total strains can then be taken as
n
equivalent, ˜ε p ≈˜ε, and Eq. 4.23 becomes ˜σ = H ˜ε .
(a) Show that the strain hardening exponent n is then expected to be equal to the true
strain ˜ε u at the engineering ultimate strength point—that is, n ≈˜ε u . (Suggestion: Start
n
by making substitutions into ˜σ = H ˜ε from Sections 4.5.1 and 4.5.2, to obtain an
equation σ = f (˜ε, H, n) that gives engineering stress.)
(b) How closely is this expectation realized for the tension test on AISI 1020 steel of
Ex. 4.1, 4.2, and 4.3? (See Table E4.1 and Fig. 4.21.)
(c) From your derivation for (a), write an equation for estimating the ultimate tensile
strength σ u from H and n. How well does this estimate work for the AISI 1020 steel
of Ex. 4.1, 4.2, and 4.3?
4.25 On the basis of the data in Tables 4.2 and 4.6 for 2024-T4 aluminum, draw the entire
engineering stress–strain curve up to the point of fracture on linear graph paper. Accurately
plot the initial elastic slope and the points corresponding to yield, ultimate, and fracture, and