
Page 186 - Mechanical Behavior of Materials
P. 186
Problems and Questions 187
4.31 Using the hardness conversion chart of Table 4.9, plot both Rockwell B and C hardness
versus ultimate tensile strength for steel. Comment on the trends observed. Is the relationship
approximately linear as for Brinell hardness?
4.32 Consider the typical hardness values for steels in Table 4.9.
(a) Plot the ultimate tensile strength σ u as a function of the Brinell hardness values HB.
Show the estimate of Eq. 4.32 on the same graph, and comment on the success of this
relationship for estimating σ u from HB.
(b) Develop an improved relationship for estimating σ u from Brinell hardness.
(c) Plot σ u as a function of the Vickers hardness values HV, and develop a relationship for
estimating σ u from HV.
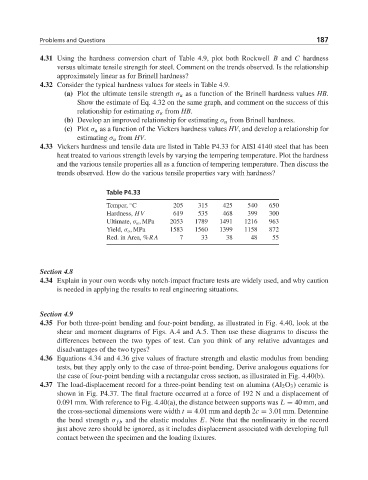
4.33 Vickers hardness and tensile data are listed in Table P4.33 for AISI 4140 steel that has been
heat treated to various strength levels by varying the tempering temperature. Plot the hardness
and the various tensile properties all as a function of tempering temperature. Then discuss the
trends observed. How do the various tensile properties vary with hardness?
Table P4.33
◦
Temper, C 205 315 425 540 650
Hardness, HV 619 535 468 399 300
Ultimate, σ u , MPa 2053 1789 1491 1216 963
Yield, σ o , MPa 1583 1560 1399 1158 872
Red. in Area, %RA 7 33 38 48 55
Section 4.8
4.34 Explain in your own words why notch-impact fracture tests are widely used, and why caution
is needed in applying the results to real engineering situations.
Section 4.9
4.35 For both three-point bending and four-point bending, as illustrated in Fig. 4.40, look at the
shear and moment diagrams of Figs. A.4 and A.5. Then use these diagrams to discuss the
differences between the two types of test. Can you think of any relative advantages and
disadvantages of the two types?
4.36 Equations 4.34 and 4.36 give values of fracture strength and elastic modulus from bending
tests, but they apply only to the case of three-point bending. Derive analogous equations for
the case of four-point bending with a rectangular cross section, as illustrated in Fig. 4.40(b).
4.37 The load-displacement record for a three-point bending test on alumina (Al 2 O 3 ) ceramic is
shown in Fig. P4.37. The final fracture occurred at a force of 192 N and a displacement of
0.091 mm. With reference to Fig. 4.40(a), the distance between supports was L = 40 mm, and
the cross-sectional dimensions were width t = 4.01 mm and depth 2c = 3.01 mm. Determine
the bend strength σ fb and the elastic modulus E. Note that the nonlinearity in the record
just above zero should be ignored, as it includes displacement associated with developing full
contact between the specimen and the loading fixtures.