
Page 181 - Mechanical Behavior of Materials
P. 181
182 Chapter 4 Mechanical Testing: Tension Test and Other Basic Tests
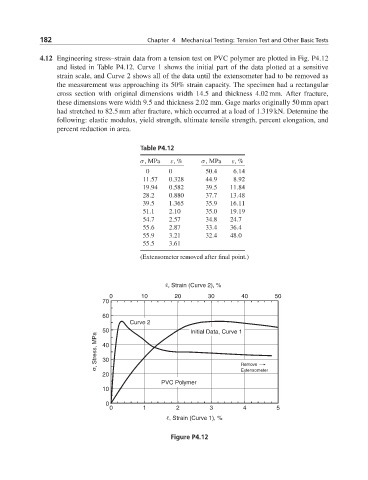
4.12 Engineering stress–strain data from a tension test on PVC polymer are plotted in Fig. P4.12
and listed in Table P4.12. Curve 1 shows the initial part of the data plotted at a sensitive
strain scale, and Curve 2 shows all of the data until the extensometer had to be removed as
the measurement was approaching its 50% strain capacity. The specimen had a rectangular
cross section with original dimensions width 14.5 and thickness 4.02 mm. After fracture,
these dimensions were width 9.5 and thickness 2.02 mm. Gage marks originally 50 mm apart
had stretched to 82.5 mm after fracture, which occurred at a load of 1.319 kN. Determine the
following: elastic modulus, yield strength, ultimate tensile strength, percent elongation, and
percent reduction in area.
Table P4.12
σ,MPa ε, % σ,MPa ε, %
0 0 50.4 6.14
11.57 0.328 44.9 8.92
19.94 0.582 39.5 11.84
28.2 0.880 37.7 13.48
39.5 1.365 35.9 16.11
51.1 2.10 35.0 19.19
54.7 2.57 34.8 24.7
55.6 2.87 33.4 36.4
55.9 3.21 32.4 48.0
55.5 3.61
(Extensometer removed after final point.)
ε, Strain (Curve 2), %
0 10 20 30 40 50
70
60
Curve 2
50 Initial Data, Curve 1
σ, Stress, MPa 40
30
Extensometer
20 Remove
PVC Polymer
10
0
0 1 2 3 4 5
ε, Strain (Curve 1), %
Figure P4.12