
Page 185 - Mechanical Behavior of Materials
P. 185
186 Chapter 4 Mechanical Testing: Tension Test and Other Basic Tests
approximately sketch the remainder of the curve. How does your result compare with the
curve for similar material in Fig. 4.15?
4.26 Proceed as in Prob. 4.25, except draw the true stress–strain curve, and also calculate several
additional ( ˜σ, ˜ε) points along the curve to aid in plotting.
Section 4.6
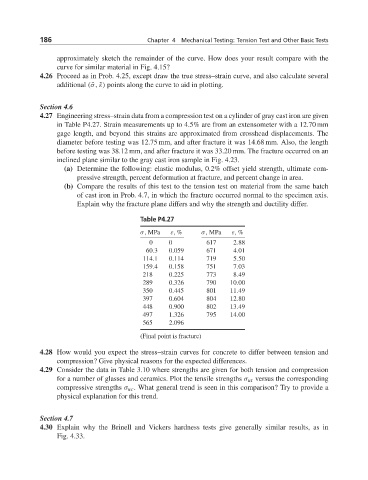
4.27 Engineering stress–strain data from a compression test on a cylinder of gray cast iron are given
in Table P4.27. Strain measurements up to 4.5% are from an extensometer with a 12.70 mm
gage length, and beyond this strains are approximated from crosshead displacements. The
diameter before testing was 12.75 mm, and after fracture it was 14.68 mm. Also, the length
before testing was 38.12 mm, and after fracture it was 33.20 mm. The fracture occurred on an
inclined plane similar to the gray cast iron sample in Fig. 4.23.
(a) Determine the following: elastic modulus, 0.2% offset yield strength, ultimate com-
pressive strength, percent deformation at fracture, and percent change in area.
(b) Compare the results of this test to the tension test on material from the same batch
of cast iron in Prob. 4.7, in which the fracture occurred normal to the specimen axis.
Explain why the fracture plane differs and why the strength and ductility differ.
Table P4.27
σ,MPa ε, % σ,MPa ε, %
0 0 617 2.88
60.3 0.059 671 4.01
114.1 0.114 719 5.50
159.4 0.158 751 7.03
218 0.225 773 8.49
289 0.326 790 10.00
350 0.445 801 11.49
397 0.604 804 12.80
448 0.900 802 13.49
497 1.326 795 14.00
565 2.096
(Final point is fracture)
4.28 How would you expect the stress–strain curves for concrete to differ between tension and
compression? Give physical reasons for the expected differences.
4.29 Consider the data in Table 3.10 where strengths are given for both tension and compression
for a number of glasses and ceramics. Plot the tensile strengths σ ut versus the corresponding
compressive strengths σ uc . What general trend is seen in this comparison? Try to provide a
physical explanation for this trend.
Section 4.7
4.30 Explain why the Brinell and Vickers hardness tests give generally similar results, as in
Fig. 4.33.