
Page 177 - Mechanical Behavior of Materials
P. 177
178 Chapter 4 Mechanical Testing: Tension Test and Other Basic Tests
Table P4.4
Force Length Change Force Length Change
P,kN L,mm P,kN L,mm
0 0 67.16 0.3944
19.04 0.0794 67.75 0.6573
38.53 0.1600 68.63 1.0951
58.81 0.2505 69.43 1.5156
65.63 0.2815 70.02 1.9534
67.60 0.2952
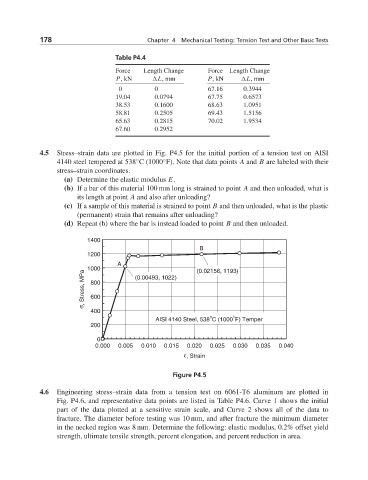
4.5 Stress–strain data are plotted in Fig. P4.5 for the initial portion of a tension test on AISI
4140 steel tempered at 538 C (1000 F). Note that data points A and B are labeled with their
◦
◦
stress–strain coordinates.
(a) Determine the elastic modulus E.
(b) If a bar of this material 100 mm long is strained to point A and then unloaded, what is
its length at point A and also after unloading?
(c) If a sample of this material is strained to point B and then unloaded, what is the plastic
(permanent) strain that remains after unloading?
(d) Repeat (b) where the bar is instead loaded to point B and then unloaded.
1400
B
1200
A
1000 (0.00493, 1022) (0.02156, 1193)
σ, Stress, MPa 800
600
400
ο
o
AISI 4140 Steel, 538 C (1000 F) Temper
200
0
0.000 0.005 0.010 0.015 0.020 0.025 0.030 0.035 0.040
ε, Strain
Figure P4.5
4.6 Engineering stress–strain data from a tension test on 6061-T6 aluminum are plotted in
Fig. P4.6, and representative data points are listed in Table P4.6. Curve 1 shows the initial
part of the data plotted at a sensitive strain scale, and Curve 2 shows all of the data to
fracture. The diameter before testing was 10 mm, and after fracture the minimum diameter
in the necked region was 8 mm. Determine the following: elastic modulus, 0.2% offset yield
strength, ultimate tensile strength, percent elongation, and percent reduction in area.