
Page 307 - Mechanical Behavior of Materials
P. 307
308 Chapter 7 Yielding and Fracture under Combined Stresses
σ 2
σ' ut
σ' uc
σ 1
0 σ' ut
σ'
uc
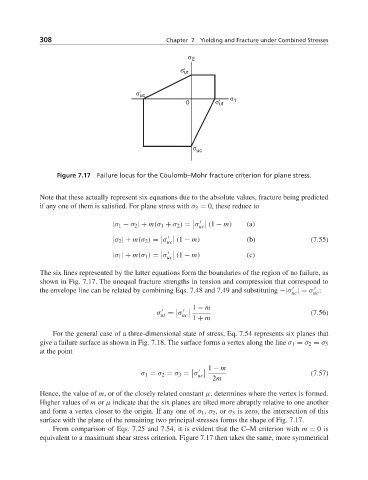
Figure 7.17 Failure locus for the Coulomb–Mohr fracture criterion for plane stress.
Note that these actually represent six equations due to the absolute values, fracture being predicted
if any one of them is satisfied. For plane stress with σ 3 = 0, these reduce to
|σ 1 − σ 2 | + m(σ 1 + σ 2 ) = σ (1 − m) (a)
uc
|σ 2 | + m(σ 2 ) = σ (1 − m) (b) (7.55)
uc
|σ 1 | + m(σ 1 ) = σ (1 − m) (c)
uc
The six lines represented by the latter equations form the boundaries of the region of no failure, as
shown in Fig. 7.17. The unequal fracture strengths in tension and compression that correspond to
the envelope line can be related by combining Eqs. 7.48 and 7.49 and substituting −|σ |= σ :
uc
uc
1 − m
σ = σ (7.56)
ut uc
1 + m
For the general case of a three-dimensional state of stress, Eq. 7.54 represents six planes that
give a failure surface as shown in Fig. 7.18. The surface forms a vertex along the line σ 1 = σ 2 = σ 3
at the point
1 − m
σ 1 = σ 2 = σ 3 = σ uc (7.57)
2m
Hence, the value of m, or of the closely related constant μ, determines where the vertex is formed.
Higher values of m or μ indicate that the six planes are tilted more abruptly relative to one another
and form a vertex closer to the origin. If any one of σ 1 , σ 2 ,or σ 3 is zero, the intersection of this
surface with the plane of the remaining two principal stresses forms the shape of Fig. 7.17.
From comparison of Eqs. 7.25 and 7.54, it is evident that the C–M criterion with m = 0is
equivalent to a maximum shear stress criterion. Figure 7.17 then takes the same, more symmetrical