
Page 305 - Mechanical Behavior of Materials
P. 305
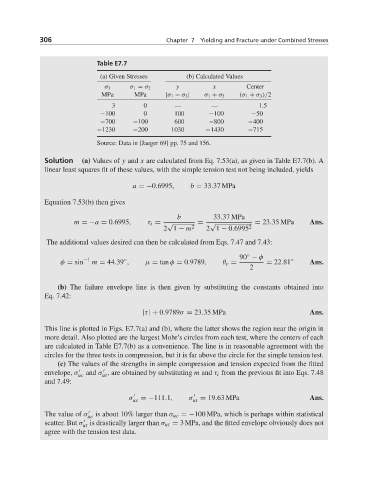
306                               Chapter 7  Yielding and Fracture under Combined Stresses


                            Table E7.7

                            (a) Given Stresses      (b) Calculated Values
                              σ 3   σ 1 = σ 2    y         x        Center
                             MPa      MPa     |σ 1 − σ 3 |  σ 1 + σ 3  (σ 1 + σ 3 )/2
                                3       0        —         —            1.5
                            −100        0        100      −100        −50
                            −700     −100        600      −800       −400
                            −1230    −200       1030     −1430       −715
                            Source: Data in [Jaeger 69] pp. 75 and 156.

             Solution  (a) Values of y and x are calculated from Eq. 7.53(a), as given in Table E7.7(b). A
             linear least squares fit of these values, with the simple tension test not being included, yields

                                     a =−0.6995,     b = 33.37 MPa

             Equation 7.53(b) then gives
                                                 b         33.37 MPa
                     m =−a = 0.6995,     τ i = √       = √             = 23.35 MPa    Ans.
                                              2 1 − m 2  2 1 − 0.6995 2
              The additional values desired can then be calculated from Eqs. 7.47 and 7.43:
                                                                   90 − φ
                                                                    ◦
                        −1
                                   ◦
                  φ = sin  m = 44.39 ,   μ = tan φ = 0.9789,  θ c =       = 22.81 ◦   Ans.
                                                                     2
                 (b) The failure envelope line is then given by substituting the constants obtained into
             Eq. 7.42:

                                        |τ| + 0.9789σ = 23.35 MPa                     Ans.

             This line is plotted in Figs. E7.7(a) and (b), where the latter shows the region near the origin in
             more detail. Also plotted are the largest Mohr’s circles from each test, where the centers of each
             are calculated in Table E7.7(b) as a convenience. The line is in reasonable agreement with the
             circles for the three tests in compression, but it is far above the circle for the simple tension test.
                 (c) The values of the strengths in simple compression and tension expected from the fitted

             envelope, σ     and σ , are obtained by substituting m and τ i from the previous fit into Eqs. 7.48
                      uc     ut
             and 7.49:


                                    σ uc  =−111.1,   σ ut  = 19.63 MPa                Ans.

             The value of σ uc  is about 10% larger than σ uc =−100 MPa, which is perhaps within statistical
             scatter. But σ is drastically larger than σ ut = 3 MPa, and the fitted envelope obviously does not

                        ut
             agree with the tension test data.