
Page 309 - Mechanical Behavior of Materials
P. 309
310 Chapter 7 Yielding and Fracture under Combined Stresses
σ
uc
¯ σ CM = MAX(C 12 , C 23 , C 31 ), X CM = (a)
¯ σ CM (7.59)
¯ σ CM = 0, X CM =∞, if MAX ≤ 0 (b)
Situation (b) arises when the combination of stresses is such that a line from the origin through the
point (σ 1 , σ 2 , σ 3 ) never intersects the failure surface of the type shown in Fig. 7.18. For example,
this occurs for σ 1 = σ 2 = σ 3 =−p, where p is pressure.
Ideally, values of σ uc and m for use in these equations would be available from fitting a
failure envelope. However, only σ uc from test data in simple compression may be available. In
this case, σ uc should be estimated as being the same as σ uc , and an estimate of m is needed.
This might be obtained by measuring the fracture angle θ c from the simple compression tests,
◦
and then applying Eqs. 7.43(b) and 7.47(a) to estimate m = sin φ = sin(90 − 2θ c ).Or m might
be known approximately from experience with similar material. For example, the paper by Paul
◦
◦
(1961) suggests a generic value for any gray cast iron of φ = 20 , corresponding to θ c = 35 and
m = 0.342.
7.7.4 Discussion
For the C–M criterion with a positive nonzero value of μ, which gives a downward-sloping failure
envelope line as in Fig. 7.14, the predicted behavior is consistent with a number of observations
that are typical of brittle materials. First, the fracture strength in compression is greater than
that in tension, with the difference increasing with the value of μ. Test data showing different
strengths in tension and compression have already been presented in Fig. 7.13 for gray cast iron.
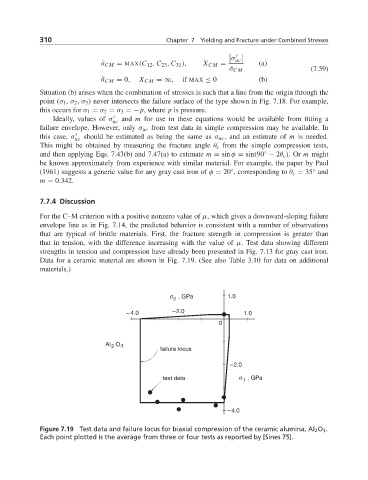
Data for a ceramic material are shown in Fig. 7.19. (See also Table 3.10 for data on additional
materials.)
σ , GPa 1.0
2
– 4.0 –2.0 1.0
0
Al O 3
2
failure locus
–2.0
test data σ , GPa
1
– 4.0
Figure 7.19 Test data and failure locus for biaxial compression of the ceramic alumina, Al 2 O 3 .
Each point plotted is the average from three or four tests as reported by [Sines 75].