
Page 182 - Petroleum Production Engineering, A Computer-Assisted Approach
P. 182
Guo, Boyun / Computer Assited Petroleum Production Engg 0750682701_chap12 Final Proof page 178 4.1.2007 2:43pm Compositor Name: SJoearun
12/178 ARTIFICIAL LIFT METHODS
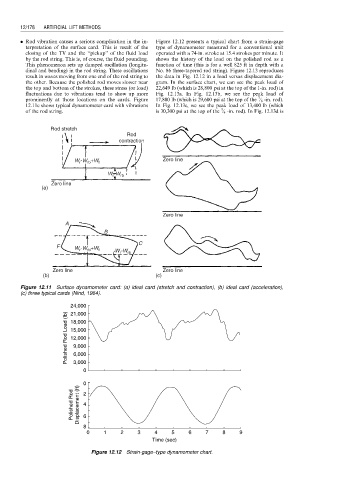
. Rod vibration causes a serious complication in the in- Figure 12.12 presents a typical chart from a strain-gage
terpretation of the surface card. This is result of the type of dynamometer measured for a conventional unit
closing of the TV and the ‘‘pickup’’ of the fluid load operated with a 74-in. stroke at 15.4 strokes per minute. It
by the rod string. This is, of course, the fluid pounding. shows the history of the load on the polished rod as a
This phenomenon sets up damped oscillation (longitu- function of time (this is for a well 825 ft in depth with a
dinal and bending) in the rod string. These oscillations No. 86 three-tapered rod string). Figure 12.13 reproduces
result in waves moving from one end of the rod string to the data in Fig. 12.12 in a load versus displacement dia-
the other. Because the polished rod moves slower near gram. In the surface chart, we can see the peak load of
the top and bottom of the strokes, these stress (or load) 22,649 lb (which is 28,800 psi at the top of the 1-in. rod) in
fluctuations due to vibrations tend to show up more Fig. 12.13a. In Fig. 12.13b, we see the peak load of
7
prominently at those locations on the cards. Figure 17,800 lb (which is 29,600 psi at the top of the ⁄ 8 -in. rod).
12.11c shows typical dynamometer card with vibrations In Fig. 12.13c, we see the peak load of 13,400 lb (which
3
of the rod string. is 30,300 psi at the top of the ⁄ 4 -in. rod). In Fig. 12.13d is
Rod stretch
Rod
contraction
-W +W Zero line
W r rb f
W -W rb
r
Zero line
(a)
Zero line
A
B
C
F W -W +W f W -W rb
r
rb
r
Zero line Zero line
(b) (c)
Figure 12.11 Surface dynamometer card: (a) ideal card (stretch and contraction), (b) ideal card (acceleration),
(c) three typical cards (Nind, 1964).
24,000
21,000
Polished Rod Load (lb) 18,000
15,000
12,000
9,000
6,000
3,000
0
0 2
Polished Rod Displacement (ft) 4
8 6
0 1 2 3 4 5 6 7 8 9
Time (sec)
Figure 12.12 Strain-gage–type dynamometer chart.