
Page 230 - Petroleum Production Engineering, A Computer-Assisted Approach
P. 230
Guo, Boyun / Computer Assited Petroleum Production Engg 0750682701_chap15 Final Proof page 228 22.12.2006 6:14pm
15/228 PRODUCTION ENHANCEMENT
15.1 Introduction . Reservoir heterogeneity (faults, stratification, etc.)
. Completion ineffectiveness (limited entry, shallow per-
The engineering work for sustaining and enhancing oil and
gas production rates starts from identifying problems that forations, low perforation density, etc.)
cause low production rates of wells, quick decline of the . Restrictions in wellbore (paraffin, asphaltane, scale, gas
desirable production fluid, or rapid increase in the undesir- hydrates, sand, etc.)
able fluids. For oil wells, these problems include The first five factors affect reservoir inflow performance,
that is, deliverability of reservoir. They can be evaluated
. Low productivity
on the basis of pressure transient data analyses.
. Excessive gas production
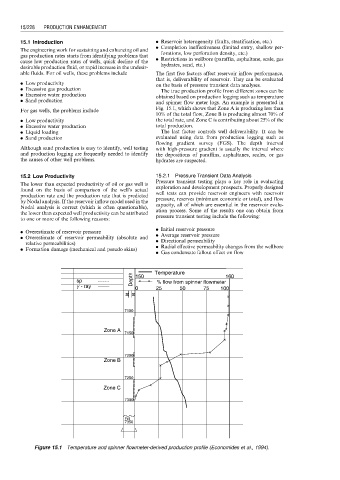
The true production profile from different zones can be
. Excessive water production
obtained based on production logging such as temperature
. Sand production
and spinner flow meter logs. An example is presented in
Fig. 15.1, which shows that Zone A is producing less than
For gas wells, the problems include
10% of the total flow, Zone B is producing almost 70% of
. Low productivity the total rate, and Zone C is contributing about 25% of the
. Excessive water production total production.
. Liquid loading The last factor controls well deliverability. It can be
. Sand production evaluated using data from production logging such as
flowing gradient survey (FGS). The depth interval
Although sand production is easy to identify, well testing with high-pressure gradient is usually the interval where
and production logging are frequently needed to identify the depositions of paraffins, asphaltanes, scales, or gas
the causes of other well problems. hydrates are suspected.
15.2 Low Productivity 15.2.1 Pressure Transient Data Analysis
Pressure transient testing plays a key role in evaluating
The lower than expected productivity of oil or gas well is
exploration and development prospects. Properly designed
found on the basis of comparison of the well’s actual
well tests can provide reservoir engineers with reservoir
production rate and the production rate that is predicted
pressure, reserves (minimum economic or total), and flow
by Nodal analysis. If the reservoir inflow model used in the
capacity, all of which are essential in the reservoir evalu-
Nodal analysis is correct (which is often questionable),
ation process. Some of the results one can obtain from
the lower than expected well productivity can be attributed
to one or more of the following reasons: pressure transient testing include the following:
. Initial reservoir pressure
. Overestimate of reservoir pressure
. Overestimate of reservoir permeability (absolute and . Average reservoir pressure
relative permeabilities) . Directional permeability
. Formation damage (mechanical and pseudo skins) . Radial effective permeability changes from the wellbore
. Gas condensate fallout effect on flow
sp Depth 150 Temperature 160
% flow from spinner flowmeter
g - ray
0 25 50 75 100
7100
Zone A
7150
7200
Zone B
7250
Zone C
7300
Fill
7350
Figure 15.1 Temperature and spinner flowmeter-derived production profile (Economides et al., 1994).