
Page 234 - Petroleum Production Engineering, A Computer-Assisted Approach
P. 234
Guo, Boyun / Computer Assited Petroleum Production Engg 0750682701_chap15 Final Proof page 232 22.12.2006 6:14pm
15/232 PRODUCTION ENHANCEMENT
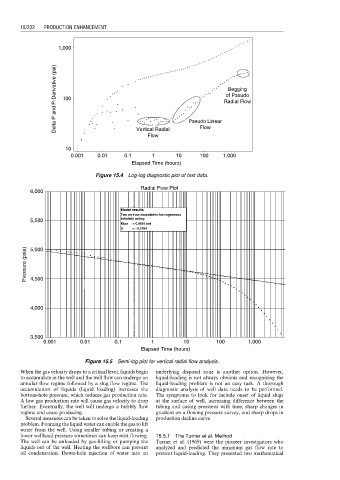
1,000
Delta P and P-Derivative (psi) 100 Radial Flow
Begging
of Pseudo
Flow
Vertical Radial
Flow Pseudo Linear
10
0.001 0.01 0.1 1 10 100 1,000
Elapsed Time (hours)
Figure 15.4 Log-log diagnostic plot of test data.
Radial Flow Plot
6,000
Model results
Two no-flow boundaries-homogeneous
5,500 Infinitely acting
Kbar = 0.9997 md
S = −0.0164
Pressure (psia) 5,000
4,500
4,000
3,500
0.001 0.01 0.1 1 10 100 1,000
Elapsed Time (hours)
Figure 15.5 Semi-log plot for vertical radial flow analysis.
When the gas velocity drops to a critical level, liquids begin underlying disposal zone is another option. However,
to accumulate in the well and the well flow can undergo an liquid-loading is not always obvious and recognizing the
annular flow regime followed by a slug flow regime. The liquid-loading problem is not an easy task. A thorough
accumulation of liquids (liquid loading) increases the diagnostic analysis of well data needs to be performed.
bottom-hole pressure, which reduces gas production rate. The symptoms to look for include onset of liquid slugs
A low gas production rate will cause gas velocity to drop at the surface of well, increasing difference between the
further. Eventually, the well will undergo a bubbly flow tubing and casing pressures with time, sharp changes in
regime and cease producing. gradient on a flowing pressure survey, and sharp drops in
Several measures can be taken to solve the liquid-loading production decline curve.
problem. Foaming the liquid water can enable the gas to lift
water from the well. Using smaller tubing or creating a
lower wellhead pressure sometimes can keep mist flowing. 15.5.1 The Turner et al. Method
The well can be unloaded by gas-lifting or pumping the Turner et al. (1969) were the pioneer investigators who
liquids out of the well. Heating the wellbore can prevent analyzed and predicted the minimum gas flow rate to
oil condensation. Down-hole injection of water into an prevent liquid-loading. They presented two mathematical