
Page 56 - Petroleum Production Engineering, A Computer-Assisted Approach
P. 56
Guo, Boyun / Petroleum Production Engineering, A Computer-Assisted Approach 0750682701_chap04 Final Proof page 47 22.12.2006 6:07pm
WELLBORE PERFORMANCE 4/47
0.1 Relative Roughness
0
0.09
0.000001
0.000005
Turbulent Flow
0.08
0.00001
0.00005
0.07
0.0001
0.0002
0.06
0.0004
Friction Factor 0.05 0.0006
0.001
0.04 0.002
0.004
0.006
0.03
Laminar 0.01
Flow
0.015
0.02
0.02
0.03
0.01
0.04
0.05
0
1.E+02 1.E+03 1.E+04 1.E+05 1.E+06 1.E+07 1.E+08
Reynolds Number
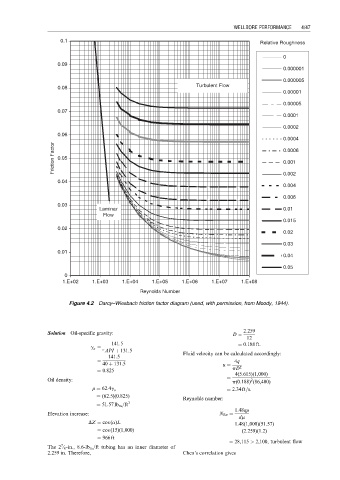
Figure 4.2 Darcy–Wiesbach friction factor diagram (used, with permission, from Moody, 1944).
2:259
Solution Oil-specific gravity: D ¼
12
141:5 ¼ 0:188 ft:
g o ¼
API þ 131:5
141:5 Fluid velocity can be calculated accordingly:
¼ 4q
40 þ 131:5 u ¼
¼ 0:825 pD 2
4(5:615)(1,000)
¼
Oil density: p(0:188) (86,400)
2
¼ 2:34 ft=s:
r ¼ 62:4g o
¼ (62:5)(0:825)
Reynolds number:
¼ 51:57 lb m =ft 3
1:48qr
Elevation increase: N Re ¼
dm
DZ ¼ cos (a)L 1:48(1,000)(51:57)
¼
¼ cos (15)(1,000) (2:259)(1:2)
¼ 966 ft
¼ 28,115 > 2,100, turbulent flow
7
The 2 ⁄ 8 -in., 8:6-lb m =ft tubing has an inner diameter of
2.259 in. Therefore, Chen’s correlation gives