
Page 61 - Petroleum Production Engineering, A Computer-Assisted Approach
P. 61
Guo, Boyun / Petroleum Production Engineering, A Computer-Assisted Approach 0750682701_chap04 Final Proof page 52 22.12.2006 6:07pm
4/52 PETROLEUM PRODUCTION ENGINEERING FUNDAMENTALS
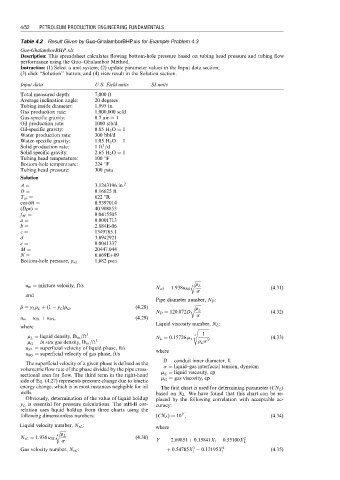
Table 4.2 Result Given by Guo-GhalamborBHP.xls for Example Problem 4.3
Guo-GhalamborBHP.xls
Description: This spreadsheet calculates flowing bottom-hole pressure based on tubing head pressure and tubing flow
performance using the Guo–Ghalambor Method.
Instruction: (1) Select a unit system; (2) update parameter values in the Input data section;
(3) click ‘‘Solution’’ button; and (4) view result in the Solution section.
Input data U.S. Field units SI units
Total measured depth: 7,000 ft
Average inclination angle: 20 degrees
Tubing inside diameter: 1.995 in.
Gas production rate: 1,000,000 scfd
Gas-specific gravity: 0.7 air ¼ 1
Oil production rate: 1000 stb/d
Oil-specific gravity: 0.85 H 2 O ¼ 1
Water production rate: 300 bbl/d
Water-specific gravity: 1.05 H 2 O ¼ 1
3
Solid production rate: 1 ft =d
Solid specific gravity: 2.65 H 2 O ¼ 1
Tubing head temperature: 100 8F
Bottom-hole temperature: 224 8F
Tubing head pressure: 300 psia
Solution
A ¼ 3.1243196 in: 2
D ¼ 0.16625 ft
T av ¼ 622 8R
cos (u) ¼ 0.9397014
(Drv) ¼ 40.908853
f M ¼ 0.0415505
a ¼ 0.0001713
b ¼ 2.884E-06
c ¼ 1349785.1
d ¼ 3.8942921
e ¼ 0.0041337
M ¼ 20447.044
N ¼ 6.669Eþ09
Bottom-hole pressure, p wf ¼ 1,682 psia
r ffiffiffiffiffiffi
u m ¼ mixture velocity, ft/s 4 r L
N vG ¼ 1:938u SG (4:31)
s
and
Pipe diameter number, N D :
r ffiffiffiffiffiffi
r r ¼ y L r L þ (1 y L )r G , (4:28) r L
N D ¼ 120:872D (4:32)
u m ¼ u SL þ u SG , (4:29) s
Liquid viscosity number, N L :
where s ffiffiffiffiffiffiffiffiffiffiffi
r L ¼ liquid density, lb m =ft 3 N L ¼ 0:15726 m L 4 1 , (4:33)
r G ¼ in situ gas density, lb m =ft 3 r L s 3
u SL ¼ superficial velocity of liquid phase, ft/s where
u SG ¼ superficial velocity of gas phase, ft/s
D ¼ conduit inner diameter, ft
The superficial velocity of a given phase is defined as the
volumetric flow rate of the phase divided by the pipe cross- s ¼ liquid–gas interfacial tension, dyne/cm
sectional area for flow. The third term in the right-hand m L ¼ liquid viscosity, cp
side of Eq. (4.27) represents pressure change due to kinetic m G ¼ gas viscosity, cp
energy change, which is in most instances negligible for oil The first chart is used for determining parameter (CN L )
wells. based on N L . We have found that this chart can be re-
Obviously, determination of the value of liquid holdup placed by the following correlation with acceptable ac-
y L is essential for pressure calculations. The mH-B cor- curacy:
relation uses liquid holdup from three charts using the
Y
following dimensionless numbers: (CN L ) ¼ 10 , (4:34)
Liquid velocity number, N vL : where
r ffiffiffiffiffiffi
4 r L
N vL ¼ 1:938 u SL (4:30) 2
s Y ¼ 2:69851 þ 0:15841X 1 0:55100X 1
3
Gas velocity number, N vG : þ 0:54785X 0:12195X 1 4 (4:35)
1