
Page 80 - Petroleum Production Engineering, A Computer-Assisted Approach
P. 80
Guo, Boyun / Computer Assited Petroleum Production Engg 0750682701_chap06 Final Proof page 72 3.1.2007 8:40pm Compositor Name: SJoearun
6/72 PETROLEUM PRODUCTION ENGINEERING FUNDAMENTALS
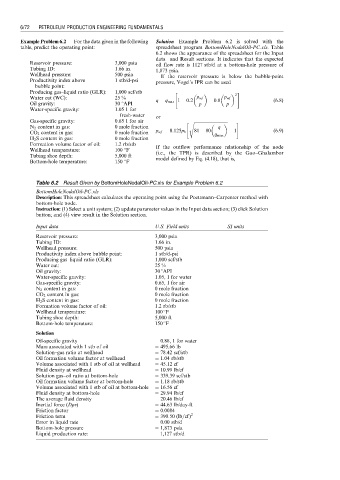
Example Problem 6.2 For the data given in the following Solution Example Problem 6.2 is solved with the
table, predict the operating point: spreadsheet program BottomHoleNodalOil-PC.xls. Table
6.2 shows the appearance of the spreadsheet for the Input
data and Result sections. It indicates that the expected
Reservoir pressure: 3,000 psia oil flow rate is 1127 stb/d at a bottom-hole pressure of
Tubing ID: 1.66 in. 1,873 psia.
Wellhead pressure: 500 psia If the reservoir pressure is below the bubble-point
Productivity index above 1 stb/d-psi pressure, Vogel’s IPR can be used
bubble point:
Producing gas–liquid ratio (GLR): 1,000 scf/stb " 2 #
Water cut (WC): 25 % q ¼ q max 1 0:2 p wf 0:8 p wf (6:8)
Oil gravity: 30 8API p p p p
Water-specific gravity: 1.05 1 for
fresh-water or
Gas-specific gravity: 0.65 1 for air " s ffiffiffiffiffiffiffiffiffiffiffiffiffiffiffiffiffiffiffiffiffiffiffiffiffiffiffiffiffiffiffiffi #
N 2 content in gas: 0 mole fraction q
CO 2 content in gas: 0 mole fraction p wf ¼ 0:125p b 81 80 1 (6:9)
q max
H 2 S content in gas: 0 mole fraction
Formation volume factor of oil: 1.2 rb/stb If the outflow performance relationship of the node
Wellhead temperature: 100 8F (i.e., the TPR) is described by the Guo–Ghalambor
Tubing shoe depth: 5,000 ft model defined by Eq. (4.18), that is,
Bottom-hole temperature: 150 8F
Table 6.2 Result Given by BottomHoleNodalOil-PC.xls for Example Problem 6.2
BottomHoleNodalOil-PC.xls
Description: This spreadsheet calculates the operating point using the Poettmann–Carpenter method with
bottom-hole node.
Instruction: (1) Select a unit system; (2) update parameter values in the Input data section; (3) click Solution
button; and (4) view result in the Solution section.
Input data U.S. Field units SI units
Reservoir pressure: 3,000 psia
Tubing ID: 1.66 in.
Wellhead pressure: 500 psia
Productivity index above bubble point: 1 stb/d-psi
Producing gas–liquid ratio (GLR): 1,000 scf/stb
Water cut: 25 %
Oil gravity: 30 8API
Water-specific gravity: 1.05, 1 for water
Gas-specific gravity: 0.65, 1 for air
N 2 content in gas: 0 mole fraction
CO 2 content in gas: 0 mole fraction
H 2 S content in gas: 0 mole fraction
Formation volume factor of oil: 1.2 rb/stb
Wellhead temperature: 100 8F
Tubing shoe depth: 5,000 ft
Bottom-hole temperature: 150 8F
Solution
Oil-specific gravity ¼ 0.88, 1 for water
Mass associated with 1 stb of oil ¼ 495.66 lb
Solution–gas ratio at wellhead ¼ 78.42 scf/stb
Oil formation volume factor at wellhead ¼ 1.04 rb/stb
Volume associated with 1 stb of oil at wellhead ¼ 45.12 cf
Fluid density at wellhead ¼ 10.99 lb/cf
Solution gas–oil ratio at bottom-hole ¼ 339.39 scf/stb
Oil formation volume factor at bottom-hole ¼ 1.18 rb/stb
Volume associated with 1 stb of oil at bottom-hole ¼ 16.56 cf
Fluid density at bottom-hole ¼ 29.94 lb/cf
The average fluid density ¼ 20.46 lb/cf
Inertial force (Drv) ¼ 44.63 lb/day-ft
Friction factor ¼ 0.0084
Friction term ¼ 390.50 (lb=cf) 2
Error in liquid rate ¼ 0.00 stb/d
Bottom-hole pressure ¼ 1,873 psia
Liquid production rate: 1,127 stb/d