
Page 92 - Petroleum Production Engineering, A Computer-Assisted Approach
P. 92
Guo, Boyun / Computer Assited Petroleum Production Engg 0750682701_chap06 Final Proof page 84 3.1.2007 8:40pm Compositor Name: SJoearun
6/84 PETROLEUM PRODUCTION ENGINEERING FUNDAMENTALS
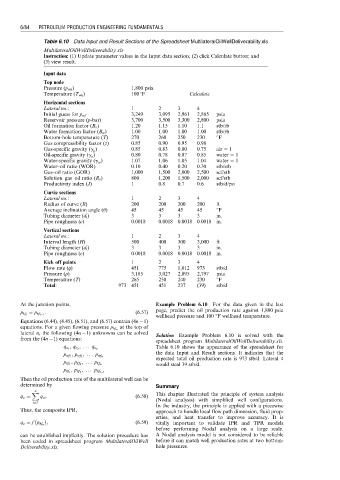
Table 6.10 Data Input and Result Sections of the Spreadsheet MultilateralOilWellDeliverability.xls
MultilateralOilWellDeliverability.xls
Instruction: (1) Update parameter values in the Input data section; (2) click Calculate button; and
(3) view result.
Input data
Top node
Pressure (p wh ) 1,800 psia
Temperature (T wh ) 100 8F Calculate
Horizontal sections
Lateral no.: 1 2 3 4
3,249 3,095 2,961 2,865 psia
Initial guess for p wf
Reservoir pressure (p-bar) 3,700 3,500 3,300 2,800 psia
Oil formation factor (B o ) 1.20 1.15 1.10 1.1 stb/rb
Water formation factor (B w ) 1.00 1.00 1.00 1.00 stb/rb
Bottom-hole temperature (T) 270 260 250 230 8F
Gas compressibility factor (z) 0.85 0.90 0.95 0.98
Gas-specific gravity (g g ) 0.85 0.83 0.80 0.75 air ¼ 1
Oil-specific gravity (g o ) 0.80 0.78 0.87 0.85 water ¼ 1
Water-specific gravity (g w ) 1.07 1.06 1.05 1.04 water ¼ 1
Water–oil ratio (WOR) 0.10 0.40 0.20 0.30 stb/stb
Gas–oil ratio (GOR) 1,000 1,500 2,000 2,500 scf/stb
Solution–gas–oil ratio (R s ) 800 1,200 1,500 2,000 scf/stb
Productivity index (J) 1 0.8 0.7 0.6 stb/d/psi
Curvic sections
Lateral no.: 1 2 3 4
Radius of curve (R) 200 200 200 200 ft
Average inclination angle (u) 45 45 45 45 8F
Tubing diameter (d i ) 3 3 3 3 in.
Pipe roughness (e) 0.0018 0.0018 0.0018 0.0018 in.
Vertical sections
Lateral no.: 1 2 3 4
Interval length (H) 500 400 300 3,000 ft
Tubing diameter (d i ) 3 3 3 3 in.
Pipe roughness (e) 0.0018 0.0018 0.0018 0.0018 in.
Kick off points 1 2 3 4
Flow rate (q) 451 775 1,012 973 stb/d
Pressure (p) 3,185 3,027 2,895 2,797 psia
Temperature (T) 265 250 240 230 8F
Total: 973 451 451 237 (39) stb/d
At the junction points, Example Problem 6.10 For the data given in the last
page, predict the oil production rate against 1,800 psia
: (6:57)
p kf i ¼ p hf i 1
wellhead pressure and 100 8F wellhead temperature.
Equations (6.44), (4.45), (6.51), and (6.57) contain (4n 1)
at the top of
equations. For a given flowing pressure p hf n
lateral n, the following (4n 1) unknowns can be solved Solution Example Problem 6.10 is solved with the
from the (4n 1) equations:
spreadsheet program MultilateralOilWellDeliverability.xls.
Table 6.10 shows the appearance of the spreadsheet for
q o 1 , q o 2 , .. . q o n
the data Input and Result sections. It indicates that the
p wf 1 , p wf 2 , .. . p wf n
expected total oil production rate is 973 stb/d. Lateral 4
would steal 39 stb/d.
p kf 1 , p kf 2 , .. . p kf n
p hf 1 , p hf 2 , ... p hf n 1
Then the oil production rate of the multilateral well can be
determined by Summary
n
X
q o ¼ q oi : (6:58) This chapter illustrated the principle of system analysis
(Nodal analysis) with simplified well configurations.
i¼1
In the industry, the principle is applied with a piecewise
Thus, the composite IPR, approach to handle local flow path dimension, fluid prop-
erties, and heat transfer to improve accuracy. It is
q o ¼ fp hf n , (6:59) vitally important to validate IPR and TPR models
before performing Nodal analysis on a large scale.
can be established implicitly. The solution procedure has A Nodal analysis model is not considered to be reliable
been coded in spreadsheet program MultilateralOilWell before it can match well production rates at two bottom-
Deliverability.xls. hole pressures.