
Page 229 -
P. 229
SLOW SAND AND DIATOMACEOUS EARTH FILTRATION 9.5
lems resulting from dissolved oxygen deficiencies include tastes and odors, redissolving
of precipitated metals, aesthetics, and increased chlorine demand (Ellis, 1985).
Nutrients. The proper operation of the schmutzdecke is somewhat dependent on the
presence of sufficient concentrations of carbon, nitrogen, phosphorus, and sulfur. Carbon
and sulfur (in sulfate form) are prevalent in most source waters. However, protected reser-
voir systems may have limited concentrations of nitrogen and phosphorus present.
It has been reported that, for every 1 mg of carbon removed by the schmutzdecke, 0.04
mg of nitrogen and 6/xg of phosphorus are required (Skeat, 1961). Slow sand filters have
also shown the ability to remove up to 3 mg/L of ammonia from source water under the
right conditions. Ammonia can be used as a source of nitrogen for the filter.
Effluent Water Quality
Slow sand filtration has been shown to be effective in achieving removal of Giardia and
viruses. Effluent turbidities in the range of 0.1 to 0.2 ntu are typical for high-quality source
waters, while turbidities of up to 1.0 ntu may be considered an upper limit. Removal of
organic substances is generally in the range of 15% to 25%. Recent research has focused
on improving removal because of disinfection by-product formation considerations.
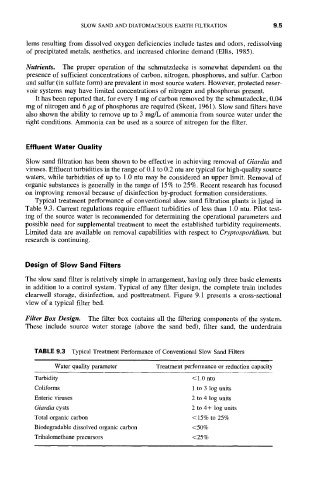
Typical treatment performance of conventional slow sand filtration plants is listed in
Table 9.3. Current regulations require effluent turbidities of less than 1.0 ntu. Pilot test-
ing of the source water is recommended for determining the operational parameters and
possible need for supplemental treatment to meet the established turbidity requirements.
Limited data are available on removal capabilities with respect to Cryptosporidium, but
research is continuing.
Design of Slow Sand Filters
The slow sand filter is relatively simple in arrangement, having only three basic elements
in addition to a control system. Typical of any filter design, the complete train includes
clearwell storage, disinfection, and posttreatment. Figure 9.1 presents a cross-sectional
view of a typical filter bed.
Filter Box Design. The filter box contains all the filtering components of the system.
These include source water storage (above the sand bed), filter sand, the underdrain
TABLE 9.3 Typical Treatment Performance of Conventional Slow Sand Filters
Water quality parameter Treatment performance or reduction capacity
Turbidity < 1.0 ntu
Coliforms 1 to 3 log units
Enteric viruses 2 to 4 log units
Giardia cysts 2 to 4+ log units
Total organic carbon <15% to 25%
Biodegradable dissolved organic carbon <50%
Trihalomethane precursors <25%