
Page 421 -
P. 421
13.18 CHAPTER THIRTEEN
3.80 i .
_ °oo
~J
40 ° C
3.00
, o c
2.60
2
2.20
'////
1.80
/
1.40
0.0 0.2 0.4 0.6 0.8 1.0 1.2 1.4 1.6 1.8 2.0
Ionic Strength
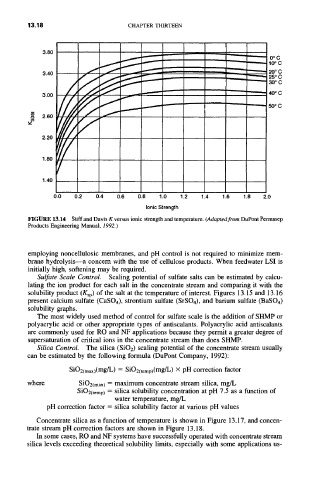
FIGURE 13.14 Stiff and Davis K versus ionic strength and temperature. (Adapted from DuPont Permasep
Products Engineering Manual, 1992.)
employing noncellulosic membranes, and pH control is not required to minimize mem-
brane hydrolysis--a concern with the use of cellulose products. When feedwater LSI is
initially high, softening may be required.
Sulfate Scale Control. Scaling potential of sulfate salts can be estimated by calcu-
lating the ion product for each salt in the concentrate stream and comparing it with the
solubility product (Ksp) of the salt at the temperature of interest. Figures 13.15 and 13.16
present calcium sulfate (CaSO4), strontium sulfate (SrSO4), and barium sulfate (BaSO4)
solubility graphs.
The most widely used method of control for sulfate scale is the addition of SHMP or
polyacrylic acid or other appropriate types of antiscalants. Polyacrylic acid antiscalants
are commonly used for RO and NF applications because they permit a greater degree of
supersaturation of critical ions in the concentrate stream than does SHMP.
Silica Control. The silica (SiO2) scaling potential of the concentrate stream usually
can be estimated by the following formula (DuPont Company, 1992):
SiO2(max)(mglL) = SiO2(temp)(mg]L) X pH correction factor
where SiO2(max) = maximum concentrate stream silica, mg/L
SiO2(temp) = silica solubility concentration at pH 7.5 as a function of
water temperature, mg/L
pH correction factor = silica solubility factor at various pH values
Concentrate silica as a function of temperature is shown in Figure 13.17, and concen-
trate stream pH correction factors are shown in Figure 13.18.
In some cases, RO and NF systems have successfully operated with concentrate stream
silica levels exceeding theoretical solubility limits, especially with some applications us-