
Page 427 - A Comprehensive Guide to Solar Energy Systems
P. 427
Chapter 22 • Life Cycle Analysis of Photovoltaics: Strategic Technology Assessment 437
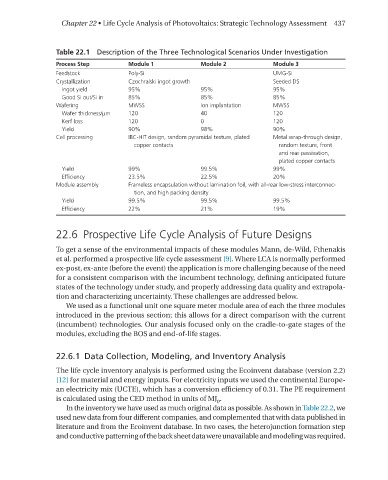
Table 22.1 Description of the Three Technological Scenarios Under Investigation
Process Step Module 1 Module 2 Module 3
Feedstock Poly-Si UMG-Si
Crystallization Czochralski ingot growth Seeded DS
Ingot yield 95% 95% 95%
Good Si out/Si in 85% 85% 85%
Wafering MWSS Ion implantation MWSS
Wafer thickness/µm 120 40 120
Kerf loss 120 0 120
Yield 90% 98% 90%
Cell processing IBC-HIT design, random pyramidal texture, plated Metal wrap-through design,
copper contacts random texture, front
and rear passivation,
plated copper contacts
Yield 99% 99.5% 99%
Efficiency 23.5% 22.5% 20%
Module assembly Frameless encapsulation without lamination foil, with all-rear low-stress interconnec-
tion, and high packing density
Yield 99.5% 99.5% 99.5%
Efficiency 22% 21% 19%
22.6 Prospective Life Cycle Analysis of Future Designs
To get a sense of the environmental impacts of these modules mann, de-Wild, Fthenakis
et al. performed a prospective life cycle assessment [9]. Where LCA is normally performed
ex-post, ex-ante (before the event) the application is more challenging because of the need
for a consistent comparison with the incumbent technology, defining anticipated future
states of the technology under study, and properly addressing data quality and extrapola-
tion and characterizing uncertainty. These challenges are addressed below.
We used as a functional unit one square meter module area of each the three modules
introduced in the previous section; this allows for a direct comparison with the current
(incumbent) technologies. Our analysis focused only on the cradle-to-gate stages of the
modules, excluding the BOS and end-of-life stages.
22.6.1 Data Collection, Modeling, and Inventory Analysis
The life cycle inventory analysis is performed using the Ecoinvent database (version 2.2)
[12] for material and energy inputs. For electricity inputs we used the continental Europe-
an electricity mix (uCTE), which has a conversion efficiency of 0.31. The PE requirement
is calculated using the CEd method in units of mJ p .
In the inventory we have used as much original data as possible. As shown in Table 22.2, we
used new data from four different companies, and complemented that with data published in
literature and from the Ecoinvent database. In two cases, the heterojunction formation step
and conductive patterning of the back sheet data were unavailable and modeling was required.