
Page 428 - A Comprehensive Guide to Solar Energy Systems
P. 428
438 A COmPREhEnSIVE GuIdE TO SOLAR EnERGy SySTEmS
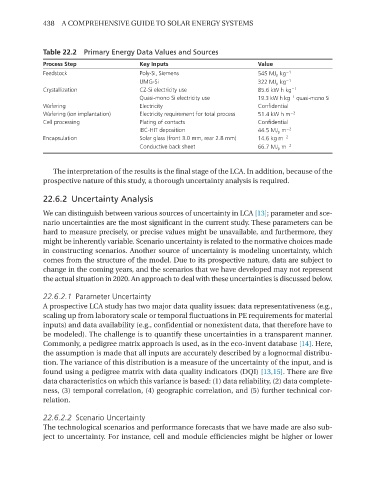
Table 22.2 Primary Energy Data Values and Sources
Process Step Key Inputs Value
Feedstock Poly-Si, Siemens 545 MJ p kg −1
UMG-Si 322 MJ p kg −1
Crystallization CZ-Si electricity use 85.6 kW h kg −1
−1
Quasi-mono Si electricity use 19.3 kW h kg quasi-mono Si
Wafering Electricity Confidential
Wafering (ion implantation) Electricity requirement for total process 51.4 kW h m −2
Cell processing Plating of contacts Confidential
IBC-HIT deposition 44.5 MJ p m −2
Encapsulation Solar glass (front 3.0 mm, rear 2.8 mm) 14.6 kg m −2
Conductive back sheet 66.7 MJ p m −2
The interpretation of the results is the final stage of the LCA. In addition, because of the
prospective nature of this study, a thorough uncertainty analysis is required.
22.6.2 Uncertainty Analysis
We can distinguish between various sources of uncertainty in LCA [13]; parameter and sce-
nario uncertainties are the most significant in the current study. These parameters can be
hard to measure precisely, or precise values might be unavailable, and furthermore, they
might be inherently variable. Scenario uncertainty is related to the normative choices made
in constructing scenarios. Another source of uncertainty is modeling uncertainty, which
comes from the structure of the model. due to its prospective nature, data are subject to
change in the coming years, and the scenarios that we have developed may not represent
the actual situation in 2020. An approach to deal with these uncertainties is discussed below.
22.6.2.1 Parameter Uncertainty
A prospective LCA study has two major data quality issues: data representativeness (e.g.,
scaling up from laboratory scale or temporal fluctuations in PE requirements for material
inputs) and data availability (e.g., confidential or nonexistent data, that therefore have to
be modeled). The challenge is to quantify these uncertainties in a transparent manner.
Commonly, a pedigree matrix approach is used, as in the eco-invent database [14]. here,
the assumption is made that all inputs are accurately described by a lognormal distribu-
tion. The variance of this distribution is a measure of the uncertainty of the input, and is
found using a pedigree matrix with data quality indicators (dQI) [13,15]. There are five
data characteristics on which this variance is based: (1) data reliability, (2) data complete-
ness, (3) temporal correlation, (4) geographic correlation, and (5) further technical cor-
relation.
22.6.2.2 Scenario Uncertainty
The technological scenarios and performance forecasts that we have made are also sub-
ject to uncertainty. For instance, cell and module efficiencies might be higher or lower