
Page 51 - A Comprehensive Guide to Solar Energy Systems
P. 51
46 A COMPREHEnSIVE GUIDE TO SOLAR EnERGy SySTEMS
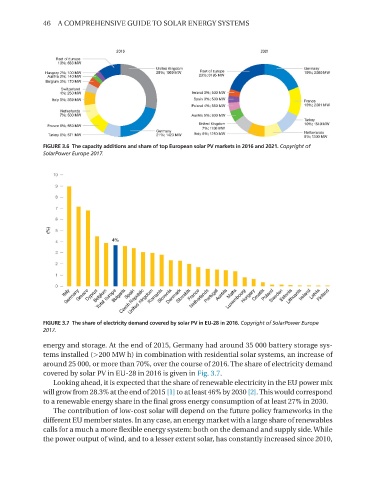
FIGURE 3.6 The capacity additions and share of top European solar PV markets in 2016 and 2021. Copyright of
SolarPower Europe 2017.
FIGURE 3.7 The share of electricity demand covered by solar PV in EU-28 in 2016. Copyright of SolarPower Europe
2017.
energy and storage. At the end of 2015, Germany had around 35 000 battery storage sys-
tems installed (>200 MW h) in combination with residential solar systems, an increase of
around 25 000, or more than 70%, over the course of 2016. The share of electricity demand
covered by solar PV in EU-28 in 2016 is given in Fig. 3.7.
Looking ahead, it is expected that the share of renewable electricity in the EU power mix
will grow from 28.3% at the end of 2015 [1] to at least 46% by 2030 [2]. This would correspond
to a renewable energy share in the final gross energy consumption of at least 27% in 2030.
The contribution of low-cost solar will depend on the future policy frameworks in the
different EU member states. In any case, an energy market with a large share of renewables
calls for a much a more flexible energy system: both on the demand and supply side. While
the power output of wind, and to a lesser extent solar, has constantly increased since 2010,