
Page 50 - A Comprehensive Guide to Solar Energy Systems
P. 50
Chapter 3 • Solar Power in Europe: Status and Outlook 45
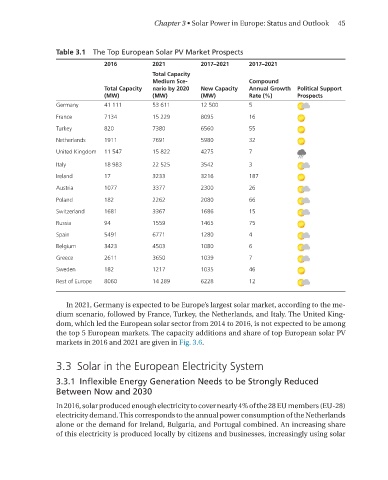
Table 3.1 The Top European Solar PV Market Prospects
2016 2021 2017–2021 2017–2021
Total Capacity
Medium Sce- Compound
Total Capacity nario by 2020 New Capacity Annual Growth Political Support
(MW) (MW) (MW) Rate (%) Prospects
Germany 41 111 53 611 12 500 5
France 7134 15 229 8095 16
Turkey 820 7380 6560 55
Netherlands 1911 7691 5980 32
United Kingdom 11 547 15 822 4275 7
Italy 18 983 22 525 3542 3
Ireland 17 3233 3216 187
Austria 1077 3377 2300 26
Poland 182 2262 2080 66
Switzerland 1681 3367 1686 15
Russia 94 1559 1465 75
Spain 5491 6771 1280 4
Belgium 3423 4503 1080 6
Greece 2611 3650 1039 7
Sweden 182 1217 1035 46
Rest of Europe 8060 14 289 6228 12
In 2021, Germany is expected to be Europe’s largest solar market, according to the me-
dium scenario, followed by France, Turkey, the netherlands, and Italy. The United King-
dom, which led the European solar sector from 2014 to 2016, is not expected to be among
the top 5 European markets. The capacity additions and share of top European solar PV
markets in 2016 and 2021 are given in Fig. 3.6.
3.3 Solar in the European Electricity System
3.3.1 Inflexible Energy Generation Needs to be Strongly Reduced
Between Now and 2030
In 2016, solar produced enough electricity to cover nearly 4% of the 28 EU members (EU-28)
electricity demand. This corresponds to the annual power consumption of the netherlands
alone or the demand for Ireland, Bulgaria, and Portugal combined. An increasing share
of this electricity is produced locally by citizens and businesses, increasingly using solar