
Page 48 - A Comprehensive Guide to Solar Energy Systems
P. 48
Chapter 3 • Solar Power in Europe: Status and Outlook 43
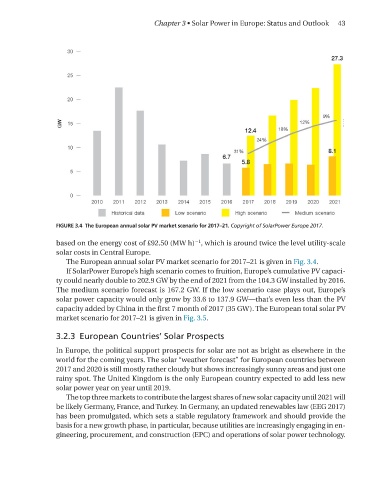
FIGURE 3.4 The European annual solar PV market scenario for 2017–21. Copyright of SolarPower Europe 2017.
−1
based on the energy cost of £92.50 (MW h) , which is around twice the level utility-scale
solar costs in Central Europe.
The European annual solar PV market scenario for 2017–21 is given in Fig. 3.4.
If SolarPower Europe’s high scenario comes to fruition, Europe’s cumulative PV capaci-
ty could nearly double to 202.9 GW by the end of 2021 from the 104.3 GW installed by 2016.
The medium scenario forecast is 167.2 GW. If the low scenario case plays out, Europe’s
solar power capacity would only grow by 33.6 to 137.9 GW—that’s even less than the PV
capacity added by China in the first 7 month of 2017 (35 GW). The European total solar PV
market scenario for 2017–21 is given in Fig. 3.5.
3.2.3 European Countries’ Solar Prospects
In Europe, the political support prospects for solar are not as bright as elsewhere in the
world for the coming years. The solar “weather forecast” for European countries between
2017 and 2020 is still mostly rather cloudy but shows increasingly sunny areas and just one
rainy spot. The United Kingdom is the only European country expected to add less new
solar power year on year until 2019.
The top three markets to contribute the largest shares of new solar capacity until 2021 will
be likely Germany, France, and Turkey. In Germany, an updated renewables law (EEG 2017)
has been promulgated, which sets a stable regulatory framework and should provide the
basis for a new growth phase, in particular, because utilities are increasingly engaging in en-
gineering, procurement, and construction (EPC) and operations of solar power technology.