
Page 263 -
P. 263
8 - PROJECT QUALITY MANAGEMENT
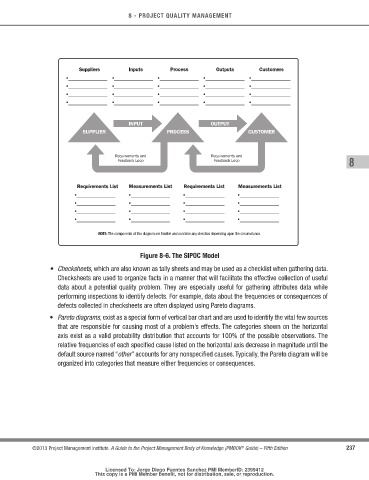
Suppliers Inputs Process Outputs Customers
• • • • •
• • • • •
• • • • •
• • • • •
INPUT OUTPUT
SUPPLIER PROCESS CUSTOMER
Requirements and Requirements and
Feedback Loop Feedback Loop 8
Requirements List Measurements List Requirements List Measurements List
• • • •
• • • •
• • • •
• • • •
NOTE: The components of this diagram are flexible and can take any direction depending upon the circumstance.
Figure 8-6. the SIPoc Model
• Checksheets, which are also known as tally sheets and may be used as a checklist when gathering data.
Checksheets are used to organize facts in a manner that will facilitate the effective collection of useful
data about a potential quality problem. They are especially useful for gathering attributes data while
performing inspections to identify defects. For example, data about the frequencies or consequences of
defects collected in checksheets are often displayed using Pareto diagrams.
• Pareto diagrams, exist as a special form of vertical bar chart and are used to identify the vital few sources
that are responsible for causing most of a problem’s effects. The categories shown on the horizontal
axis exist as a valid probability distribution that accounts for 100% of the possible observations. The
relative frequencies of each specified cause listed on the horizontal axis decrease in magnitude until the
default source named “other” accounts for any nonspecified causes. Typically, the Pareto diagram will be
organized into categories that measure either frequencies or consequences.
®
©2013 Project Management Institute. A Guide to the Project Management Body of Knowledge (PMBOK Guide) – Fifth Edition 237
Licensed To: Jorge Diego Fuentes Sanchez PMI MemberID: 2399412
This copy is a PMI Member benefit, not for distribution, sale, or reproduction.