
Page 265 -
P. 265
8 - PROJECT QUALITY MANAGEMENT
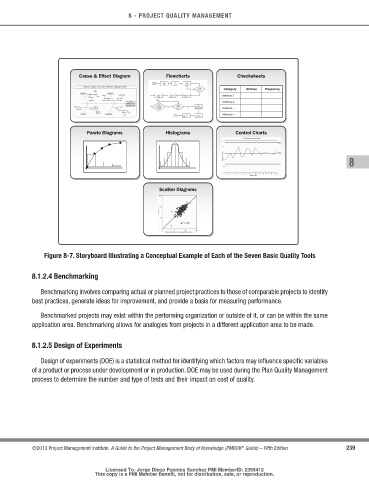
Cause & Effect Diagram Flowcharts Checksheets
Pareto Diagrams Histograms Control Charts
8
Scatter Diagrams
Figure 8-7. Storyboard Illustrating a conceptual Example of Each of the Seven Basic Quality tools
8.1.2.4 Benchmarking
Benchmarking involves comparing actual or planned project practices to those of comparable projects to identify
best practices, generate ideas for improvement, and provide a basis for measuring performance.
Benchmarked projects may exist within the performing organization or outside of it, or can be within the same
application area. Benchmarking allows for analogies from projects in a different application area to be made.
8.1.2.5 design of Experiments
Design of experiments (DOE) is a statistical method for identifying which factors may influence specific variables
of a product or process under development or in production. DOE may be used during the Plan Quality Management
process to determine the number and type of tests and their impact on cost of quality.
®
©2013 Project Management Institute. A Guide to the Project Management Body of Knowledge (PMBOK Guide) – Fifth Edition 239
Licensed To: Jorge Diego Fuentes Sanchez PMI MemberID: 2399412
This copy is a PMI Member benefit, not for distribution, sale, or reproduction.