
Page 173 - Acquisition and Processing of Marine Seismic Data
P. 173
164 2. MARINE SEISMIC DATA ACQUISITION
TABLE 2.21 Example List of Weekly Production Details
Date Seq. Line FSP LSP TSP Length Infill Prime Total FF
2 2 2
(km) (km ) (km ) (km )
01.08.2016 042 DEG16-1442P1042 1511 3261 1751 43.775 0.00 21.88 21.88
043 DEG16-1418P1043 1210 3423 2214 55.350 0.00 27.67 27.67
044 DEG16-1388F1044 3220 3907 688 17.200 8.60 0.00 8.60
02.08.2016 045 DEG16-1243P1045 1124 3268 2145 53.625 0.00 26.81 26.81
046 DEG16-1189P1046 1652 3106 1455 36.375 0.00 18.18 18.18
03.08.2016 046 DEG16-1189P1046 3107 1809 703 17.575 0.00 8.78 8.78
047 DEG16-1145P1047 1853 3507 1655 41.375 0.00 20.68 20.68
048 DEG16-1014P1048 2314 2755 442 11.050 0.00 5.52 5.52
04.08.2016 049 DEG16-1512F1049 3568 4153 586 14.650 7.32 0.00 7.32
050 DEG16-1546F1050 2536 3793 1258 31.450 15.72 0.00 15.72
051 DEG16-1635F1051 1965 3440 1476 36.900 18.45 0.00 18.45
05.08.2016 052 DEG16-1693F1052 1645 2507 863 21.575 10.78 0.00 10.78
053 DEG16-1726F1053 2687 3054 368 9.200 4.60 0.00 4.60
054 DEG16-1204P1054 1235 2076 842 21.500 0.00 10.75 10.75
06.08.2016 054 DEG16-1267P1054 2077 3180 1104 27.600 0.00 13.80 13.80
055 DEG16-1296P1055 1456 3110 1655 41.375 0.00 20.68 20.68
07.08.2016 056 DEG16-1314P1056 1024 1780 757 18.925 0.00 9.46 9.46
057 DEG16-1388P1057 1227 1546 320 8.000 0.00 4.00 4.00
Total weekly production 20,282 507,500 65.47 188.21 253.68
FSP is first shot point, LSP is last shot point, TSP is total shot point along the line, and FF is full fold.
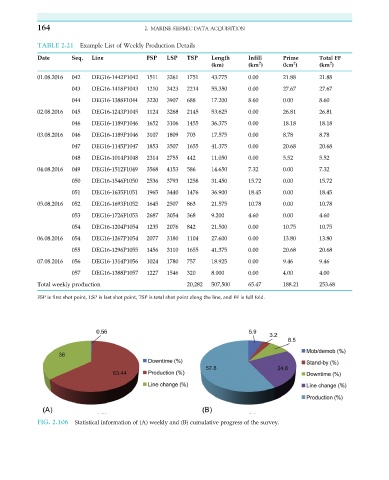
FIG. 2.106 Statistical information of (A) weekly and (B) cumulative progress of the survey.