
Page 171 - Acquisition and Processing of Marine Seismic Data
P. 171
162 2. MARINE SEISMIC DATA ACQUISITION
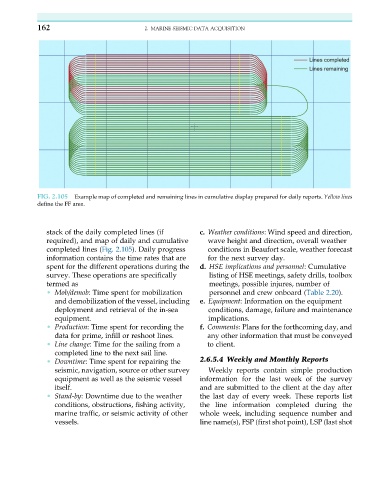
FIG. 2.105 Example map of completed and remaining lines in cumulative display prepared for daily reports. Yellow lines
define the FF area.
stack of the daily completed lines (if c. Weather conditions: Wind speed and direction,
required), and map of daily and cumulative wave height and direction, overall weather
completed lines (Fig. 2.105). Daily progress conditions in Beaufort scale, weather forecast
information contains the time rates that are for the next survey day.
spent for the different operations during the d. HSE implications and personnel: Cumulative
survey. These operations are specifically listing of HSE meetings, safety drills, toolbox
termed as meetings, possible injures, number of
• Mob/demob: Time spent for mobilization personnel and crew onboard (Table 2.20).
and demobilization of the vessel, including e. Equipment: Information on the equipment
deployment and retrieval of the in-sea conditions, damage, failure and maintenance
equipment. implications.
• Production: Time spent for recording the f. Comments: Plans for the forthcoming day, and
data for prime, infill or reshoot lines. any other information that must be conveyed
• Line change: Time for the sailing from a to client.
completed line to the next sail line.
• Downtime: Time spent for repairing the 2.6.5.4 Weekly and Monthly Reports
seismic, navigation, source or other survey Weekly reports contain simple production
equipment as well as the seismic vessel information for the last week of the survey
itself. and are submitted to the client at the day after
• Stand-by: Downtime due to the weather the last day of every week. These reports list
conditions, obstructions, fishing activity, the line information completed during the
marine traffic, or seismic activity of other whole week, including sequence number and
vessels. line name(s), FSP (first shot point), LSP (last shot