
Page 18 - Acquisition and Processing of Marine Seismic Data
P. 18
1.2 MARINE ACOUSTIC METHODS 9
2
sensors using the specific instruments in the sea- B ¼ 1:389 1:262E-2T +7:166E-5T
water regularly positioned along the spread. +2:008E-6T 3:21E-8T Þ
4
3
Therefore, the sound velocity in the water col- + ð9:4742E-5 1:2583E-5T 6:4928E-8T 2
umn must be continuously measured in real 3 4
time during 3D surveys, since it may change +1:0515E-8T 2:0142E-10T ÞP
with time and location in the survey area. + ð 3:9064E-7 + 9:1061E-9T
2
3
Variation of the sound velocity in seawater 1:6009E-10T +7:994E-12T ÞP 2
can be obtained using velocimeters, which +1:100E-10 + 6:651E-12T
ð
directly measure the velocity, or the specific sen- 2 3
3:391E-13T ÞP
sors termed CTDs (conductivity-transmission-
depth), which measure the physical parameters C ¼ 1:922E-2 4:42E-5T
used to calculate the sound velocity. In addition, +7:3637E-5 + 1:7950E-7TÞP
ð
an expendable bathythermograph (XBT) probe
can be used to measure the temperature of the D ¼ 1:727E-3 7:9836E-6P
upper kilometer of the ocean, and the data is
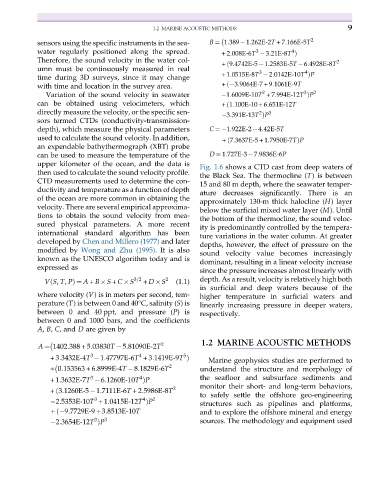
Fig. 1.6 shows a CTD cast from deep waters of
then used to calculate the sound velocity profile.
the Black Sea. The thermocline (T) is between
CTD measurements used to determine the con-
15 and 80 m depth, where the seawater temper-
ductivity and temperature as a function of depth
ature decreases significantly. There is an
of the ocean are more common in obtaining the
approximately 130-m thick halocline (H) layer
velocity. There are several empirical approxima-
below the surficial mixed water layer (M). Until
tions to obtain the sound velocity from mea-
the bottom of the thermocline, the sound veloc-
sured physical parameters. A more recent
ity is predominantly controlled by the tempera-
international standard algorithm has been ture variations in the water column. At greater
developed by Chen and Millero (1977) and later depths, however, the effect of pressure on the
modified by Wong and Zhu (1995). It is also sound velocity value becomes increasingly
known as the UNESCO algorithm today and is dominant, resulting in a linear velocity increase
expressed as
since the pressure increases almost linearly with
VS, T, PÞ ¼ A + B S + C S 3=2 + D S 2 (1.1) depth. As a result, velocity is relatively high both
ð
in surficial and deep waters because of the
where velocity (V) is in meters per second, tem- higher temperature in surficial waters and
perature (T) is between 0 and 40°C, salinity (S)is linearly increasing pressure in deeper waters,
between 0 and 40 ppt, and pressure (P)is respectively.
between 0 and 1000 bars, and the coefficients
A, B, C, and D are given by
2 1.2 MARINE ACOUSTIC METHODS
A ¼ 1402:388 + 5:03830T 5:81090E-2T
3 4 5
+3:3432E-4T 1:47797E-6T +3:1419E-9T Þ Marine geophysics studies are performed to
+0:153563 + 6:8999E-4T 8:1829E-6T 2 understand the structure and morphology of
4
3
+1:3632E-7T 6:1260E-10T ÞP the seafloor and subsurface sediments and
monitor their short- and long-term behaviors,
2
+ ð3:1260E-5 1:7111E-6T +2:5986E-8T
to safely settle the offshore geo-engineering
3
4
2:5353E-10T +1:0415E-12T ÞP 2 structures such as pipelines and platforms,
+ ð 9:7729E-9 + 3:8513E-10T and to explore the offshore mineral and energy
2
2:3654E-12T ÞP 3 sources. The methodology and equipment used