
Page 22 - Acquisition and Processing of Marine Seismic Data
P. 22
1.2 MARINE ACOUSTIC METHODS 13
FIG. 1.7 Schematic display of the applications of (A) single-beam and (B) multibeam echosounders and the data obtained.
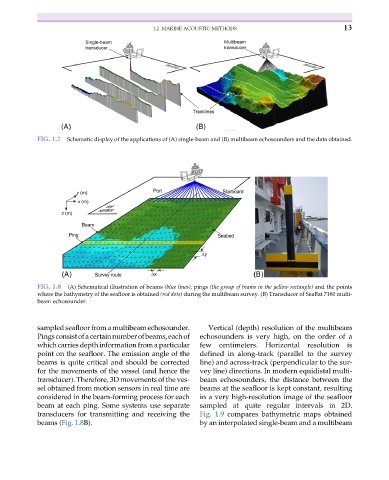
FIG. 1.8 (A) Schematical illustration of beams (blue lines), pings (the group of beams in the yellow rectangle) and the points
where the bathymetry of the seafloor is obtained (red dots) during the multibeam survey. (B) Transducer of SeaBat 7160 multi-
beam echosounder.
sampled seafloor froma multibeam echosounder. Vertical (depth) resolution of the multibeam
Pingsconsistofacertainnumberofbeams,eachof echosounders is very high, on the order of a
which carries depthinformation from a particular few centimeters. Horizontal resolution is
point on the seafloor. The emission angle of the defined in along-track (parallel to the survey
beams is quite critical and should be corrected line) and across-track (perpendicular to the sur-
for the movements of the vessel (and hence the vey line) directions. In modern equidistal multi-
transducer). Therefore, 3D movements of the ves- beam echosounders, the distance between the
sel obtained from motion sensors in real time are beams at the seafloor is kept constant, resulting
considered in the beam-forming process for each in a very high-resolution image of the seafloor
beam at each ping. Some systems use separate sampled at quite regular intervals in 2D.
transducers for transmitting and receiving the Fig. 1.9 compares bathymetric maps obtained
beams (Fig. 1.8B). by an interpolated single-beam and a multibeam