
Page 23 - Acquisition and Processing of Marine Seismic Data
P. 23
14 1. INTRODUCTION
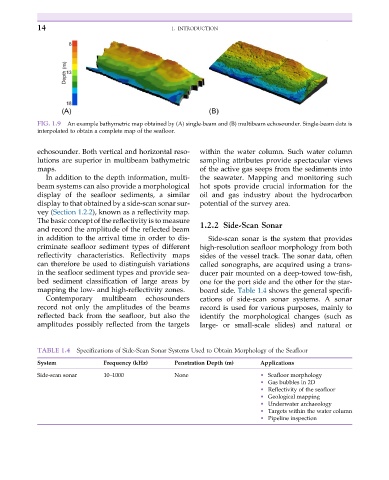
FIG. 1.9 An example bathymetric map obtained by (A) single-beam and (B) multibeam echosounder. Single-beam data is
interpolated to obtain a complete map of the seafloor.
echosounder. Both vertical and horizontal reso- within the water column. Such water column
lutions are superior in multibeam bathymetric sampling attributes provide spectacular views
maps. of the active gas seeps from the sediments into
In addition to the depth information, multi- the seawater. Mapping and monitoring such
beam systems can also provide a morphological hot spots provide crucial information for the
display of the seafloor sediments, a similar oil and gas industry about the hydrocarbon
display to that obtained by a side-scan sonar sur- potential of the survey area.
vey (Section 1.2.2), known as a reflectivity map.
The basic concept of the reflectivity is to measure 1.2.2 Side-Scan Sonar
and record the amplitude of the reflected beam
in addition to the arrival time in order to dis- Side-scan sonar is the system that provides
criminate seafloor sediment types of different high-resolution seafloor morphology from both
reflectivity characteristics. Reflectivity maps sides of the vessel track. The sonar data, often
can therefore be used to distinguish variations called sonographs, are acquired using a trans-
in the seafloor sediment types and provide sea- ducer pair mounted on a deep-towed tow-fish,
bed sediment classification of large areas by one for the port side and the other for the star-
mapping the low- and high-reflectivity zones. board side. Table 1.4 shows the general specifi-
Contemporary multibeam echosounders cations of side-scan sonar systems. A sonar
record not only the amplitudes of the beams record is used for various purposes, mainly to
reflected back from the seafloor, but also the identify the morphological changes (such as
amplitudes possibly reflected from the targets large- or small-scale slides) and natural or
TABLE 1.4 Specifications of Side-Scan Sonar Systems Used to Obtain Morphology of the Seafloor
System Frequency (kHz) Penetration Depth (m) Applications
Side-scan sonar 10–1000 None • Seafloor morphology
• Gas bubbles in 2D
• Reflectivity of the seafloor
• Geological mapping
• Underwater archaeology
• Targets within the water column
• Pipeline inspection