
Page 210 - Acquisition and Processing of Marine Seismic Data
P. 210
3.10 OTHER NOISE TYPES 201
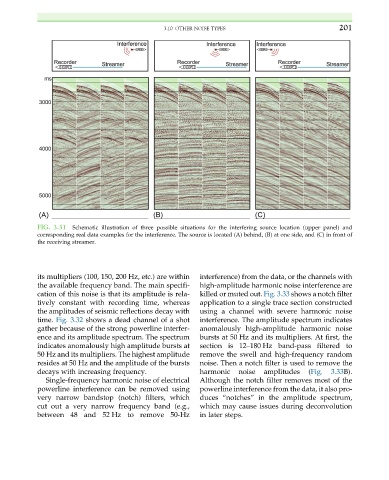
FIG. 3.31 Schematic illustration of three possible situations for the interfering source location (upper panel) and
corresponding real data examples for the interference. The source is located (A) behind, (B) at one side, and (C) in front of
the receiving streamer.
its multipliers (100, 150, 200 Hz, etc.) are within interference) from the data, or the channels with
the available frequency band. The main specifi- high-amplitude harmonic noise interference are
cation of this noise is that its amplitude is rela- killed or muted out. Fig. 3.33 shows a notch filter
tively constant with recording time, whereas application to a single trace section constructed
the amplitudes of seismic reflections decay with using a channel with severe harmonic noise
time. Fig. 3.32 shows a dead channel of a shot interference. The amplitude spectrum indicates
gather because of the strong powerline interfer- anomalously high-amplitude harmonic noise
ence and its amplitude spectrum. The spectrum bursts at 50 Hz and its multipliers. At first, the
indicates anomalously high amplitude bursts at section is 12–180 Hz band-pass filtered to
50 Hz and its multipliers. The highest amplitude remove the swell and high-frequency random
resides at 50 Hz and the amplitude of the bursts noise. Then a notch filter is used to remove the
decays with increasing frequency. harmonic noise amplitudes (Fig. 3.33B).
Single-frequency harmonic noise of electrical Although the notch filter removes most of the
powerline interference can be removed using powerline interference from the data, it also pro-
very narrow bandstop (notch) filters, which duces “notches” in the amplitude spectrum,
cut out a very narrow frequency band (e.g., which may cause issues during deconvolution
between 48 and 52 Hz to remove 50-Hz in later steps.