
Page 206 - Acquisition and Processing of Marine Seismic Data
P. 206
3.9 SEISMIC INTERFERENCE 197
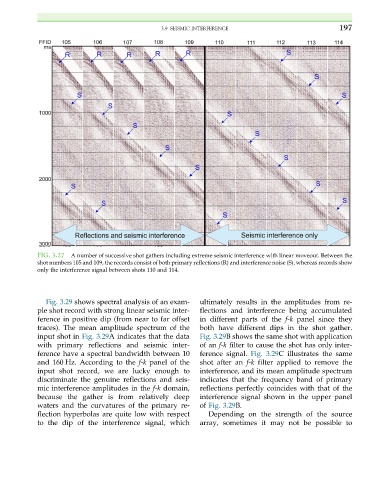
FIG. 3.27 A number of successive shot gathers including extreme seismic interference with linear moveout. Between the
shot numbers 105 and 109, the records consist of both primary reflections (R) and interference noise (S), whereas records show
only the interference signal between shots 110 and 114.
Fig. 3.29 shows spectral analysis of an exam- ultimately results in the amplitudes from re-
ple shot record with strong linear seismic inter- flections and interference being accumulated
ference in positive dip (from near to far offset in different parts of the f-k panel since they
traces). The mean amplitude spectrum of the both have different dips in the shot gather.
input shot in Fig. 3.29A indicates that the data Fig. 3.29B shows the same shot with application
with primary reflections and seismic inter- of an f-k filter to cause the shot has only inter-
ference have a spectral bandwidth between 10 ference signal. Fig. 3.29C illustrates the same
and 160 Hz. According to the f-k panel of the shot after an f-k filter applied to remove the
input shot record, we are lucky enough to interference, and its mean amplitude spectrum
discriminate the genuine reflections and seis- indicates that the frequency band of primary
mic interference amplitudes in the f-k domain, reflections perfectly coincides with that of the
because the gather is from relatively deep interference signal shown in the upper panel
waters and the curvatures of the primary re- of Fig. 3.29B.
flection hyperbolas are quite low with respect Depending on the strength of the source
to the dip of the interference signal, which array, sometimes it may not be possible to