
Page 237 - Acquisition and Processing of Marine Seismic Data
P. 237
228 4. FUNDAMENTALS OF DATA PROCESSING
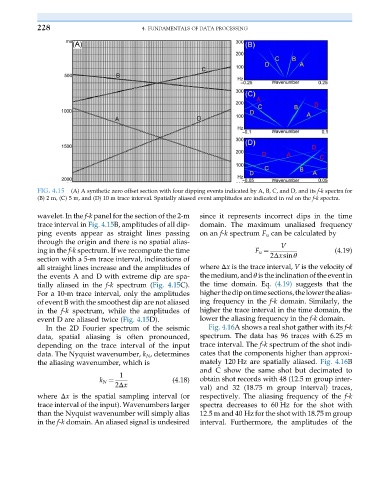
FIG. 4.15 (A) A synthetic zero offset section with four dipping events indicated by A, B, C, and D, and its f-k spectra for
(B) 2 m, (C) 5 m, and (D) 10 m trace interval. Spatially aliased event amplitudes are indicated in red on the f-k spectra.
wavelet. In the f-k panel for the section of the 2-m since it represents incorrect dips in the time
trace interval in Fig. 4.15B, amplitudes of all dip- domain. The maximum unaliased frequency
ping events appear as straight lines passing on an f-k spectrum F u can be calculated by
through the origin and there is no spatial alias- V
ing in the f-k spectrum. If we recompute the time F u ¼ 2Δxsinθ (4.19)
section with a 5-m trace interval, inclinations of
all straight lines increase and the amplitudes of where Δx is the trace interval, V is the velocity of
the events A and D with extreme dip are spa- the medium,andθ is theinclination of theeventin
tially aliased in the f-k spectrum (Fig. 4.15C). the time domain. Eq. (4.19) suggests that the
For a 10-m trace interval, only the amplitudes higherthedipontimesections,thelowerthealias-
of event B with the smoothest dip are not aliased ing frequency in the f-k domain. Similarly, the
in the f-k spectrum, while the amplitudes of higher the trace interval in the time domain, the
event D are aliased twice (Fig. 4.15D). lower the aliasing frequency in the f-k domain.
In the 2D Fourier spectrum of the seismic Fig. 4.16A shows a real shot gather with its f-k
data, spatial aliasing is often pronounced, spectrum. The data has 96 traces with 6.25 m
depending on the trace interval of the input trace interval. The f-k spectrum of the shot indi-
data. The Nyquist wavenumber, k N , determines cates that the components higher than approxi-
the aliasing wavenumber, which is mately 120 Hz are spatially aliased. Fig. 4.16B
and C show the same shot but decimated to
1
k N ¼ (4.18) obtain shot records with 48 (12.5 m group inter-
2Δx
val) and 32 (18.75 m group interval) traces,
where Δx is the spatial sampling interval (or respectively. The aliasing frequency of the f-k
trace interval of the input). Wavenumbers larger spectra decreases to 60 Hz for the shot with
than the Nyquist wavenumber will simply alias 12.5 m and 40 Hz for the shot with 18.75 m group
in the f-k domain. An aliased signal is undesired interval. Furthermore, the amplitudes of the