
Page 232 - Acquisition and Processing of Marine Seismic Data
P. 232
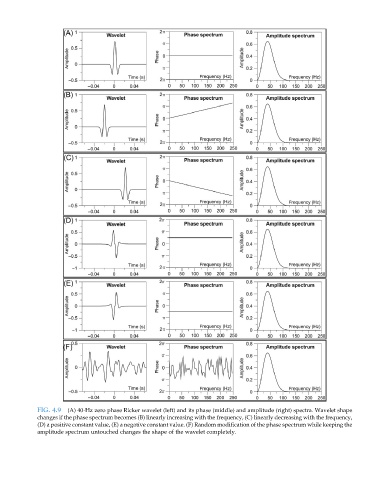
FIG. 4.9  (A) 40-Hz zero phase Ricker wavelet (left) and its phase (middle) and amplitude (right) spectra. Wavelet shape
           changes if the phase spectrum becomes (B) linearly increasing with the frequency, (C) linearly decreasing with the frequency,
           (D) a positive constant value, (E) a negative constant value. (F) Random modification of the phase spectrum while keeping the
           amplitude spectrum untouched changes the shape of the wavelet completely.