
Page 234 - Acquisition and Processing of Marine Seismic Data
P. 234
4.6 2D FOURIER TRANSFORM 225
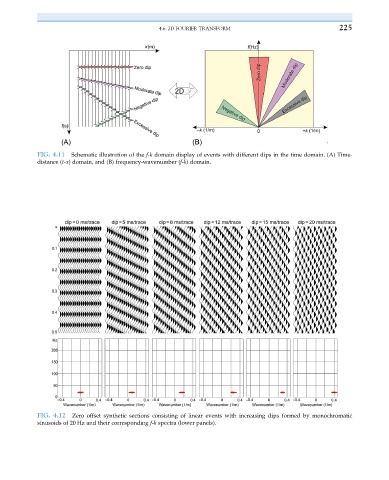
FIG. 4.11 Schematic illustration of the f-k domain display of events with different dips in the time domain. (A) Time-
distance (t-x) domain, and (B) frequency-wavenumber (f-k) domain.
FIG. 4.12 Zero offset synthetic sections consisting of linear events with increasing dips formed by monochromatic
sinusoids of 20 Hz and their corresponding f-k spectra (lower panels).