
Page 231 - Acquisition and Processing of Marine Seismic Data
P. 231
222 4. FUNDAMENTALS OF DATA PROCESSING
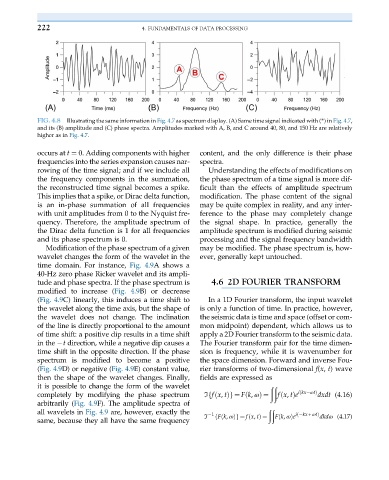
FIG. 4.8 Illustrating the same information in Fig. 4.7 as spectrum display. (A) Same time signal indicated with (*)in Fig. 4.7,
and its (B) amplitude and (C) phase spectra. Amplitudes marked with A, B, and C around 40, 80, and 150 Hz are relatively
higher as in Fig. 4.7.
occurs at t ¼ 0. Adding components with higher content, and the only difference is their phase
frequencies into the series expansion causes nar- spectra.
rowing of the time signal; and if we include all Understanding the effects of modifications on
the frequency components in the summation, the phase spectrum of a time signal is more dif-
the reconstructed time signal becomes a spike. ficult than the effects of amplitude spectrum
This implies that a spike, or Dirac delta function, modification. The phase content of the signal
is an in-phase summation of all frequencies may be quite complex in reality, and any inter-
with unit amplitudes from 0 to the Nyquist fre- ference to the phase may completely change
quency. Therefore, the amplitude spectrum of the signal shape. In practice, generally the
the Dirac delta function is 1 for all frequencies amplitude spectrum is modified during seismic
and its phase spectrum is 0. processing and the signal frequency bandwidth
Modification of the phase spectrum of a given may be modified. The phase spectrum is, how-
wavelet changes the form of the wavelet in the ever, generally kept untouched.
time domain. For instance, Fig. 4.9A shows a
40-Hz zero phase Ricker wavelet and its ampli-
tude and phase spectra. If the phase spectrum is 4.6 2D FOURIER TRANSFORM
modified to increase (Fig. 4.9B) or decrease
(Fig. 4.9C) linearly, this induces a time shift to In a 1D Fourier transform, the input wavelet
the wavelet along the time axis, but the shape of is only a function of time. In practice, however,
the wavelet does not change. The inclination the seismic data is time and space (offset or com-
of the line is directly proportional to the amount mon midpoint) dependent, which allows us to
of time shift: a positive dip results in a time shift apply a 2D Fourier transform to the seismic data.
in the t direction, while a negative dip causes a The Fourier transform pair for the time dimen-
time shift in the opposite direction. If the phase sion is frequency, while it is wavenumber for
spectrum is modified to become a positive the space dimension. Forward and inverse Fou-
(Fig. 4.9D) or negative (Fig. 4.9E) constant value, rier transforms of two-dimensional f(x, t) wave
then the shape of the wavelet changes. Finally, fields are expressed as
it is possible to change the form of the wavelet ðð
ð
completely by modifying the phase spectrum ℑ fx, tÞg ¼ Fk, ωÞ ¼ fx, tÞe ikx ωtÞ dxdt (4.16)
f
ð
ð
ð
arbitrarily (Fig. 4.9F). The amplitude spectra of
all wavelets in Fig. 4.9 are, however, exactly the ℑ 1 ðð Fk, ωÞe i kx + ωtÞ dkdω (4.17)
ð
ð
ð
same, because they all have the same frequency f Fk, ωÞg ¼ fx, tÞ ¼ ð