
Page 230 - Acquisition and Processing of Marine Seismic Data
P. 230
4.5 1D FOURIER TRANSFORM 221
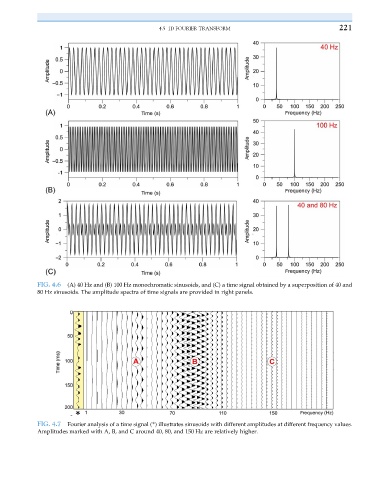
FIG. 4.6 (A) 40 Hz and (B) 100 Hz monochromatic sinusoids, and (C) a time signal obtained by a superposition of 40 and
80 Hz sinusoids. The amplitude spectra of time signals are provided in right panels.
FIG. 4.7 Fourier analysis of a time signal (*) illustrates sinusoids with different amplitudes at different frequency values.
Amplitudes marked with A, B, and C around 40, 80, and 150 Hz are relatively higher.