
Page 233 - Acquisition and Processing of Marine Seismic Data
P. 233
224 4. FUNDAMENTALS OF DATA PROCESSING
Using a 2D Fourier transform, the signal amplitudes are aligned approaches to the hori-
observed in the time-distance (t-x) domain is zontal wavenumber axis in the f-k panel as the
transferred into the frequency-wavenumber dip of the event in the time domain increases
(f-k) domain. Hence, the obtained spectrum is (Fig. 4.11).
also known as the f-k spectrum. A 2D Fourier Fig. 4.12 shows zero offset synthetic seismo-
transform of discrete signals is achieved by grams formed by 20-Hz monochromatic sinu-
successive application of the 1D Fourier trans- soids consisting of linear events with increasing
form: the first one is along the time axis, which dips. Because the sections have monofrequency
transforms the data from the (t, x)to(f, x) sinusoids with a unique positive dip, their ampli-
domain. Then a second 1D Fourier transform tudes appear at their corresponding single fre-
is performed along the distance axis, which quency and wavenumber values in the f-k
transforms the data from the (f, x)to(f, k) spectra. A 0° dip corresponds to 0 wavenumber
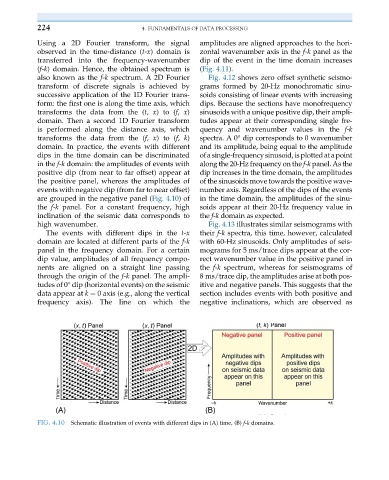
domain. In practice, the events with different and its amplitude, being equal to the amplitude
dips in the time domain can be discriminated ofasingle-frequencysinusoid,isplottedatapoint
in the f-k domain: the amplitudes of events with along the 20-Hz frequency on the f-k panel. As the
positive dip (from near to far offset) appear at dip increases in the time domain, the amplitudes
the positive panel, whereas the amplitudes of of the sinusoids move towards the positive wave-
events with negative dip (from far to near offset) number axis. Regardless of the dips of the events
are grouped in the negative panel (Fig. 4.10)of in the time domain, the amplitudes of the sinu-
the f-k panel. For a constant frequency, high soids appear at their 20-Hz frequency value in
inclination of the seismic data corresponds to the f-k domain as expected.
high wavenumber. Fig. 4.13 illustrates similar seismograms with
The events with different dips in the t-x their f-k spectra, this time, however, calculated
domain are located at different parts of the f-k with 60-Hz sinusoids. Only amplitudes of seis-
panel in the frequency domain. For a certain mograms for 5 ms/trace dips appear at the cor-
dip value, amplitudes of all frequency compo- rect wavenumber value in the positive panel in
nents are aligned on a straight line passing the f-k spectrum, whereas for seismograms of
through the origin of the f-k panel. The ampli- 8 ms/trace dip, the amplitudes arise at both pos-
tudes of 0° dip (horizontal events) on the seismic itive and negative panels. This suggests that the
data appear at k ¼ 0 axis (e.g., along the vertical section includes events with both positive and
frequency axis). The line on which the negative inclinations, which are observed as
FIG. 4.10 Schematic illustration of events with different dips in (A) time, (B) f-k domains.