
Page 428 - Acquisition and Processing of Marine Seismic Data
P. 428
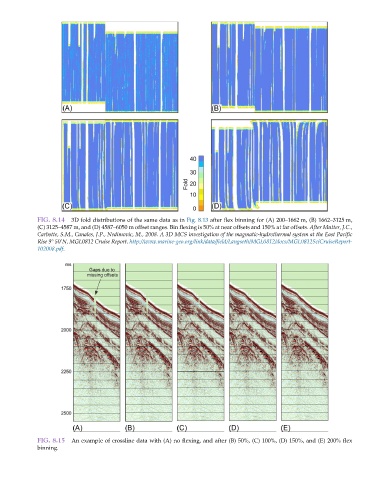
FIG. 8.14  3D fold distributions of the same data as in Fig. 8.13 after flex binning for (A) 200–1662 m, (B) 1662–3125 m,
           (C) 3125–4587 m, and (D) 4587–6050 m offset ranges. Bin flexing is 50% at near offsets and 150% at far offsets. After Mutter, J.C.,
           Carbotte, S.M., Canales, J.P., Nedimovic, M., 2008. A 3D MCS investigation of the magmatic-hydrothermal system at the East Pacific
           Rise 9° 50’N, MGL0812 Cruise Report. http://www.marine-geo.org/link/data/field/Langseth/MGL0812/docs/MGL0812SciCruiseReport-
           102008.pdf.


           FIG. 8.15  An example of crossline data with (A) no flexing, and after (B) 50%, (C) 100%, (D) 150%, and (E) 200% flex
           binning.