
Page 424 - Acquisition and Processing of Marine Seismic Data
P. 424
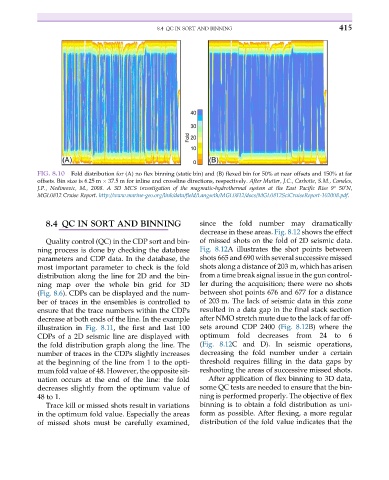
8.4 QC IN SORT AND BINNING                        415


           FIG. 8.10  Fold distribution for (A) no flex binning (static bin) and (B) flexed bin for 50% at near offsets and 150% at far
           offsets. Bin size is 6.25 m   37.5 m for inline and crossline directions, respectively. After Mutter, J.C., Carbotte, S.M., Canales,
           J.P., Nedimovic, M., 2008. A 3D MCS investigation of the magmatic-hydrothermal system at the East Pacific Rise 9° 50’N,
           MGL0812 Cruise Report. http://www.marine-geo.org/link/data/field/Langseth/MGL0812/docs/MGL0812SciCruiseReport-102008.pdf.


              8.4 QC IN SORT AND BINNING                since the fold number may dramatically
                                                        decrease in these areas. Fig. 8.12 shows the effect
              Quality control (QC) in the CDP sort and bin-  of missed shots on the fold of 2D seismic data.
           ning process is done by checking the database  Fig. 8.12A illustrates the shot points between
           parameters and CDP data. In the database, the  shots 665 and 690 with several successive missed
           most important parameter to check is the fold  shots along a distance of 203 m, which has arisen
           distribution along the line for 2D and the bin-  from a time break signal issue in the gun control-
           ning map over the whole bin grid for 3D      ler during the acquisition; there were no shots
           (Fig. 8.6). CDPs can be displayed and the num-  between shot points 676 and 677 for a distance
           ber of traces in the ensembles is controlled to  of 203 m. The lack of seismic data in this zone
           ensure that the trace numbers within the CDPs  resulted in a data gap in the final stack section
           decrease at both ends of the line. In the example  after NMO stretch mute due to the lack of far off-
           illustration in Fig. 8.11, the first and last 100  sets around CDP 2400 (Fig. 8.12B) where the
           CDPs of a 2D seismic line are displayed with  optimum   fold  decreases  from  24  to  6
           the fold distribution graph along the line. The  (Fig. 8.12C and D). In seismic operations,
           number of traces in the CDPs slightly increases  decreasing the fold number under a certain
           at the beginning of the line from 1 to the opti-  threshold requires filling in the data gaps by
           mum fold value of 48. However, the opposite sit-  reshooting the areas of successive missed shots.
           uation occurs at the end of the line: the fold  After application of flex binning to 3D data,
           decreases slightly from the optimum value of  some QC tests are needed to ensure that the bin-
           48 to 1.                                     ning is performed properly. The objective of flex
              Trace kill or missed shots result in variations  binning is to obtain a fold distribution as uni-
           in the optimum fold value. Especially the areas  form as possible. After flexing, a more regular
           of missed shots must be carefully examined,  distribution of the fold value indicates that the