
Page 427 - Acquisition and Processing of Marine Seismic Data
P. 427
418 8. CDP SORT AND BINNING
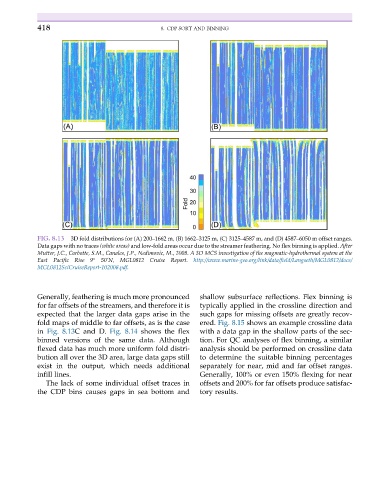
FIG. 8.13 3D fold distributions for (A) 200–1662 m, (B) 1662–3125 m, (C) 3125–4587 m, and (D) 4587–6050 m offset ranges.
Data gaps with no traces (white areas) and low-fold areas occur due to the streamer feathering. No flex binning is applied. After
Mutter, J.C., Carbotte, S.M., Canales, J.P., Nedimovic, M., 2008. A 3D MCS investigation of the magmatic-hydrothermal system at the
East Pacific Rise 9° 50’N, MGL0812 Cruise Report. http://www.marine-geo.org/link/data/field/Langseth/MGL0812/docs/
MGL0812SciCruiseReport-102008.pdf.
Generally, feathering is much more pronounced shallow subsurface reflections. Flex binning is
for far offsets of the streamers, and therefore it is typically applied in the crossline direction and
expected that the larger data gaps arise in the such gaps for missing offsets are greatly recov-
fold maps of middle to far offsets, as is the case ered. Fig. 8.15 shows an example crossline data
in Fig. 8.13C and D. Fig. 8.14 shows the flex with a data gap in the shallow parts of the sec-
binned versions of the same data. Although tion. For QC analyses of flex binning, a similar
flexed data has much more uniform fold distri- analysis should be performed on crossline data
bution all over the 3D area, large data gaps still to determine the suitable binning percentages
exist in the output, which needs additional separately for near, mid and far offset ranges.
infill lines. Generally, 100% or even 150% flexing for near
The lack of some individual offset traces in offsets and 200% for far offsets produce satisfac-
the CDP bins causes gaps in sea bottom and tory results.