
Page 426 - Acquisition and Processing of Marine Seismic Data
P. 426
8.4 QC IN SORT AND BINNING 417
CDP 2135 2225 2315 2405 2495 2585 2675 2765 2855
ms
Data gap
100
200
669
670
671
672
673
674
675
No shots for 203 m
676
300
Shot
points 677
400 679 678
680
681
682
683
684
685
686
687
688 (A)
(B) 689
500
−50 27
26
26 26
−100 25
24 24 24
−150 23
22 22 22
−200 21
20 20 20
18 18 −250 19
CDP fold 16 16 OFFSET −300 17
16
15
14
14
−350
12 12 −400 14
13
18 CDP fold
12
10 10 11
−450
8 8 10
−500 9
6 6 8
Fold 7
4 4 −550 6
decrease
2 2 −600 5
(C) (D) 4
3
2
500 1000 1500 2000 2500 3000 3500 500 1000 1500 2000 2500 3000 3500
CDP CDP
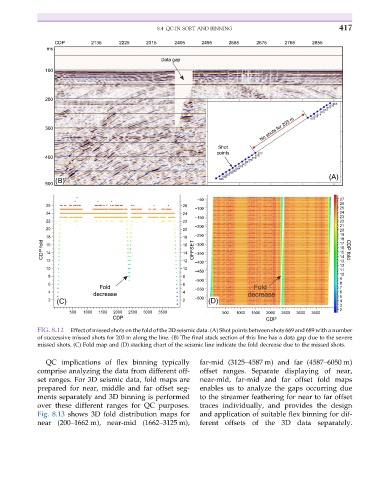
FIG. 8.12 Effect of missed shots on the fold of the 2D seismic data. (A) Shot points between shots 669 and 689 with a number
of successive missed shots for 203 m along the line. (B) The final stack section of this line has a data gap due to the severe
missed shots. (C) Fold map and (D) stacking chart of the seismic line indicate the fold decrease due to the missed shots.
QC implications of flex binning typically far-mid (3125–4587 m) and far (4587–6050 m)
comprise analyzing the data from different off- offset ranges. Separate displaying of near,
set ranges. For 3D seismic data, fold maps are near-mid, far-mid and far offset fold maps
prepared for near, middle and far offset seg- enables us to analyze the gaps occurring due
ments separately and 3D binning is performed to the streamer feathering for near to far offset
over these different ranges for QC purposes. traces individually, and provides the design
Fig. 8.13 shows 3D fold distribution maps for and application of suitable flex binning for dif-
near (200–1662 m), near-mid (1662–3125 m), ferent offsets of the 3D data separately.