
Page 421 - Acquisition and Processing of Marine Seismic Data
P. 421
412 8. CDP SORT AND BINNING
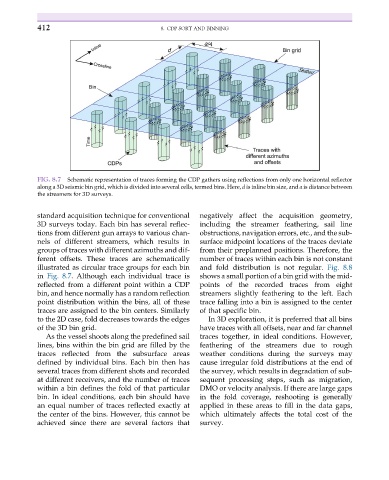
FIG. 8.7 Schematic representation of traces forming the CDP gathers using reflections from only one horizontal reflector
along a 3D seismic bin grid, which is divided into several cells, termed bins. Here, d is inline bin size, and a is distance between
the streamers for 3D surveys.
standard acquisition technique for conventional negatively affect the acquisition geometry,
3D surveys today. Each bin has several reflec- including the streamer feathering, sail line
tions from different gun arrays to various chan- obstructions, navigation errors, etc., and the sub-
nels of different streamers, which results in surface midpoint locations of the traces deviate
groups of traces with different azimuths and dif- from their preplanned positions. Therefore, the
ferent offsets. These traces are schematically number of traces within each bin is not constant
illustrated as circular trace groups for each bin and fold distribution is not regular. Fig. 8.8
in Fig. 8.7. Although each individual trace is shows a small portion of a bin grid with the mid-
reflected from a different point within a CDP points of the recorded traces from eight
bin, and hence normally has a random reflection streamers slightly feathering to the left. Each
point distribution within the bins, all of these trace falling into a bin is assigned to the center
traces are assigned to the bin centers. Similarly of that specific bin.
to the 2D case, fold decreases towards the edges In 3D exploration, it is preferred that all bins
of the 3D bin grid. have traces with all offsets, near and far channel
As the vessel shoots along the predefined sail traces together, in ideal conditions. However,
lines, bins within the bin grid are filled by the feathering of the streamers due to rough
traces reflected from the subsurface areas weather conditions during the surveys may
defined by individual bins. Each bin then has cause irregular fold distributions at the end of
several traces from different shots and recorded the survey, which results in degradation of sub-
at different receivers, and the number of traces sequent processing steps, such as migration,
within a bin defines the fold of that particular DMO or velocity analysis. If there are large gaps
bin. In ideal conditions, each bin should have in the fold coverage, reshooting is generally
an equal number of traces reflected exactly at applied in these areas to fill in the data gaps,
the center of the bins. However, this cannot be which ultimately affects the total cost of the
achieved since there are several factors that survey.