
Page 310 - Adsorbents fundamentals and applications
P. 310
AIR SEPARATION 295
1.6
Nitrogen
1.4 Li 94.2 Na 0.7 Ag 1.1 -X-1.0
Amount adsorbed, m mol/g 1.0 Li 94.5 Na 1.5 -X-1.0
1.2
0.8
0.6
0.4
0.2 Li 94.2 Na 0.7 Ag 1.1 -X-1.0 Oxygen
Li 94.5 Na 1.5 -X-1.0
0.0
0.0 0.1 0.2 0.3 0.4 0.5 0.6 0.7 0.8 0.9 1.0
Pressure, atm
◦
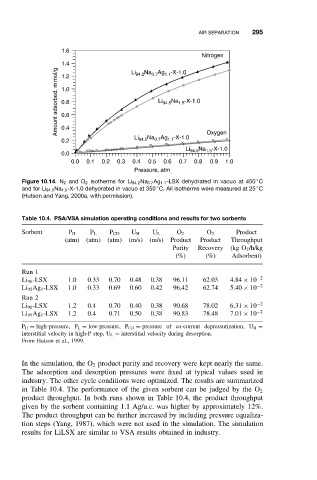
Figure 10.14. N 2 and O 2 isotherms for Li 94.2 Na 0.7 Ag 1.1 -LSX dehydrated in vacuo at 450 C
◦
◦
and for Li 94.5 Na 1.5 -X-1.0 dehydrated in vacuo at 350 C. All isotherms were measured at 25 C
(Hutson and Yang, 2000a, with permission).
Table 10.4. PSA/VSA simulation operating conditions and results for two sorbents
Sorbent P H P L P CD U H U L O 2 O 2 Product
(atm) (atm) (atm) (m/s) (m/s) Product Product Throughput
Purity Recovery (kg O 2 /h/kg
(%) (%) Adsorbent)
Run 1
Li 96 -LSX 1.0 0.33 0.70 0.48 0.38 96.11 62.03 4.84 × 10 −2
Li 95 Ag 1 -LSX 1.0 0.33 0.69 0.60 0.42 96.42 62.74 5.40 × 10 −2
Run 2
Li 96 -LSX 1.2 0.4 0.70 0.40 0.38 90.68 78.02 6.31 × 10 −2
Li 95 Ag 1 -LSX 1.2 0.4 0.71 0.50 0.38 90.83 78.48 7.01 × 10 −2
P H = high-pressure, P L = low-pressure, P CD = pressure of co-current depressurization, U H =
interstitial velocity in high-P step, U L = interstitial velocity during desorption.
From Hutson et al., 1999.
In the simulation, the O 2 product purity and recovery were kept nearly the same.
The adsorption and desorption pressures were fixed at typical values used in
industry. The other cycle conditions were optimized. The results are summarized
in Table 10.4. The performance of the given sorbent can be judged by the O 2
product throughput. In both runs shown in Table 10.4, the product throughput
given by the sorbent containing 1.1 Ag/u.c. was higher by approximately 12%.
The product throughput can be further increased by including pressure equaliza-
tion steps (Yang, 1987), which were not used in the simulation. The simulation
results for LiLSX are similar to VSA results obtained in industry.