
Page 297 - Advanced Organic Chemistry Part A - Structure and Mechanisms, 5th ed (2007) - Carey _ Sundberg
P. 297
278
C
CHAPTER 3
Structural Effects on
Stability and Reactivity
A B
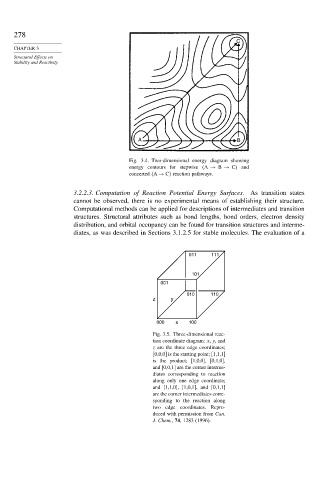
Fig. 3.4. Two-dimensional energy diagram showing
energy contours for stepwise A → B → C and
concerted A → C reaction pathways.
3.2.2.3. Computation of Reaction Potential Energy Surfaces. As transition states
cannot be observed, there is no experimental means of establishing their structure.
Computational methods can be applied for descriptions of intermediates and transition
structures. Structural attributes such as bond lengths, bond orders, electron density
distribution, and orbital occupancy can be found for transition structures and interme-
diates, as was described in Sections 3.1.2.5 for stable molecules. The evaluation of a
011 111
101
001
010 110
z y
000 x 100
Fig. 3.5. Three-dimensional reac-
tion coordinate diagram: x, y, and
z are the three edge coordinates;
[0,0,0] is the starting point; [1,1,1]
is the product; [1,0,0], [0,1,0],
and [0,0,1] are the corner interme-
diates corresponding to reaction
along only one edge coordinate;
and [1,1,0], [1,0,1], and [0,1,1]
are the corner intermediates corre-
sponding to the reaction along
two edge coordinates. Repro-
duced with permission from Can.
J. Chem., 74, 1283 (1996).