
Page 294 - Advanced Organic Chemistry Part A - Structure and Mechanisms, 5th ed (2007) - Carey _ Sundberg
P. 294
transition state 275
SECTION 3.2
Chemical Kinetics
G ‡
ΔG
A + B ΔG
reactants C + D
product
(a) Energy diagram for a single-step reaction.
transition state
transition state
B + C
G ΔG 1 ‡
‡
intermediates ΔG 2
(+ D)
ΔG
A
reactant E + F
(+ D) products
(b) Energy diagram for a two-step reaction.
C
D+E
ΔG ‡
G 2
A + B ‡ (+ F)
ΔG ΔG ‡
(+ F) 1 3 ΔG
G + E
(c) Energy diagram for a three-step reaction.
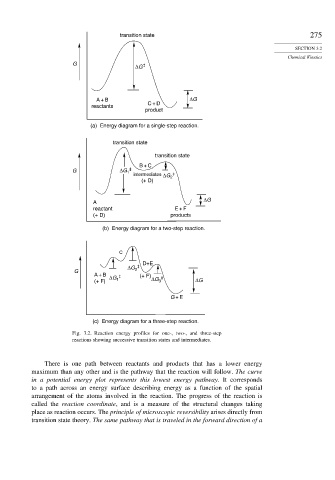
Fig. 3.2. Reaction energy profiles for one-, two-, and three-step
reactions showing successive transition states and intermediates.
There is one path between reactants and products that has a lower energy
maximum than any other and is the pathway that the reaction will follow. The curve
in a potential energy plot represents this lowest energy pathway. It corresponds
to a path across an energy surface describing energy as a function of the spatial
arrangement of the atoms involved in the reaction. The progress of the reaction is
called the reaction coordinate, and is a measure of the structural changes taking
place as reaction occurs. The principle of microscopic reversibility arises directly from
transition state theory. The same pathway that is traveled in the forward direction of a