
Page 296 - Advanced Organic Chemistry Part A - Structure and Mechanisms, 5th ed (2007) - Carey _ Sundberg
P. 296
X – H XY 277
X-Z bond breaking n + Z
–
H X SECTION 3.2
n
Y b 2 Chemical Kinetics
b 1 a 2
C
X-Y bond formation H X X-Y bond formation
–
X
n
Y
a 1
H X-Z X-Z bond breaking H n X +
+
n
–
+ Y Y + Z
– –
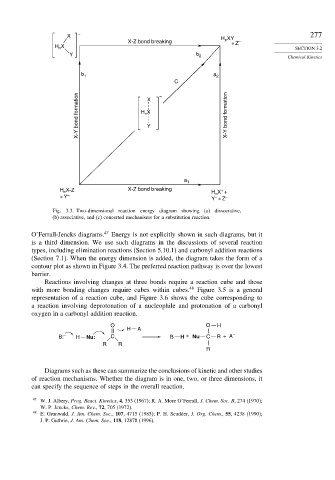
Fig. 3.3. Two-dimensional reaction energy diagram showing (a) dissociative,
(b) associative, and (c) concerted mechanisms for a substitution reaction.
O’Ferrall-Jencks diagrams. 47 Energy is not explicitly shown in such diagrams, but it
is a third dimension. We use such diagrams in the discussions of several reaction
types, including elimination reactions (Section 5.10.1) and carbonyl addition reactions
(Section 7.1). When the energy dimension is added, the diagram takes the form of a
contour plot as shown in Figure 3.4. The preferred reaction pathway is over the lowest
barrier.
Reactions involving changes at three bonds require a reaction cube and those
with more bonding changes require cubes within cubes. 48 Figure 3.5 is a general
representation of a reaction cube, and Figure 3.6 shows the cube corresponding to
a reaction involving deprotonation of a nucleophile and protonation of a carbonyl
oxygen in a carbonyl addition reaction.
O O H
H A
B: – H Nu: C B H + Nu C R + A –
R R
R
Diagrams such as these can summarize the conclusions of kinetic and other studies
of reaction mechanisms. Whether the diagram is in one, two, or three dimensions, it
can specify the sequence of steps in the overall reaction.
47 W. J. Albery, Prog. React. Kinetics, 4, 353 (1967); R. A. More O’Ferrall, J. Chem. Soc. B, 274 (1970);
W. P. Jencks, Chem. Rev., 72, 705 (1972).
48
E. Grunwald, J. Am. Chem. Soc., 107, 4715 (1985); P. H. Scudder, J. Org. Chem., 55, 4238 (1990);
J. P. Guthrie, J. Am. Chem. Soc., 118, 12878 (1996).