
Page 80 - Advanced Organic Chemistry Part A - Structure and Mechanisms, 5th ed (2007) - Carey _ Sundberg
P. 80
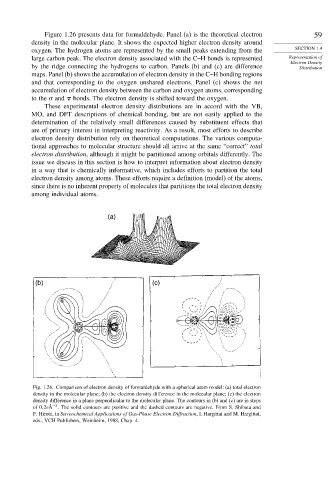
Figure 1.26 presents data for formaldehyde. Panel (a) is the theoretical electron  59
          density in the molecular plane. It shows the expected higher electron density around
          oxygen. The hydrogen atoms are represented by the small peaks extending from the  SECTION 1.4
          large carbon peak. The electron density associated with the C–H bonds is represented  Representation of
                                                                                        Electron Density
          by the ridge connecting the hydrogens to carbon. Panels (b) and (c) are difference  Distribution
          maps. Panel (b) shows the accumulation of electron density in the C–H bonding regions
          and that corresponding to the oxygen unshared electrons. Panel (c) shows the net
          accumulation of electron density between the carbon and oxygen atoms, corresponding
          to the   and   bonds. The electron density is shifted toward the oxygen.
              These experimental electron density distributions are in accord with the VB,
          MO, and DFT descriptions of chemical bonding, but are not easily applied to the
          determination of the relatively small differences caused by substituent effects that
          are of primary interest in interpreting reactivity. As a result, most efforts to describe
          electron density distribution rely on theoretical computations. The various computa-
          tional approaches to molecular structure should all arrive at the same “correct” total
          electron distribution, although it might be partitioned among orbitals differently. The
          issue we discuss in this section is how to interpret information about electron density
          in a way that is chemically informative, which includes efforts to partition the total
          electron density among atoms. These efforts require a definition (model) of the atoms,
          since there is no inherent property of molecules that partitions the total electron density
          among individual atoms.


                                 (a)


            (b)                                (c)


           Fig. 1.26. Comparison of electron density of formaldehyde with a spherical atom model: (a) total electron
           density in the molecular plane; (b) the electron density difference in the molecular plane; (c) the electron
           density difference in a plane perpendicular to the molecular plane. The contours in (b) and (c) are in steps
                 −3
           of 0 2eÅ . The solid contours are positive and the dashed contours are negative. From S. Shibata and
           F. Hirota, in Stereochemical Applications of Gas-Phase Electron Diffraction, I. Hargittai and M. Hargittai,
           eds., VCH Publishers, Weinheim, 1988, Chap. 4.