
Page 78 - Advanced Organic Chemistry Part A - Structure and Mechanisms, 5th ed (2007) - Carey _ Sundberg
P. 78
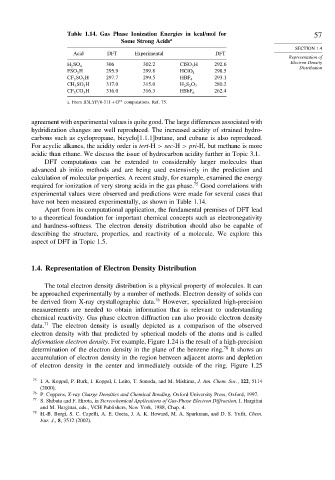
Table 1.14. Gas Phase Ionization Energies in kcal/mol for                 57
                                     Some Strong Acids a
                                                                                          SECTION 1.4
                       Acid      DFT      Experimental            DFT
                                                                                        Representation of
                                 306        302 2      ClSO 3 H  292 6                  Electron Density
                     H 2 SO 4
                                                                                           Distribution
                     FSO 3 H     295 9      299 8      HClO 4    298 5
                     CF 3 SO 3 H  297 7     299 5      HBF 4     293 1
                     CH 3 SO 3 H  317 0     315 0      H 2 S 2 O 7  280 2
                     CF 3 CO 3 H  316 0     316 3      HSbF 6    262 4
                     a. From B3LYP/6-311+G ∗∗  computations. Ref. 75.

          agreement with experimental values is quite good. The large differences associated with
          hydridization changes are well reproduced. The increased acidity of strained hydro-
          carbons such as cyclopropane, bicyclo[1.1.1]butane, and cubane is also reproduced.
          For acyclic alkanes, the acidity order is tert-H > sec-H > pri-H, but methane is more
          acidic than ethane. We discuss the issue of hydrocarbon acidity further in Topic 3.1.
              DFT computations can be extended to considerably larger molecules than
          advanced ab initio methods and are being used extensively in the prediction and
          calculation of molecular properties. A recent study, for example, examined the energy
                                                           75
          required for ionization of very strong acids in the gas phase. Good correlations with
          experimental values were observed and predictions were made for several cases that
          have not been measured experimentally, as shown in Table 1.14.
              Apart from its computational application, the fundamental premises of DFT lead
          to a theoretical foundation for important chemical concepts such as electronegativity
          and hardness-softness. The electron density distribution should also be capable of
          describing the structure, properties, and reactivity of a molecule. We explore this
          aspect of DFT in Topic 1.5.


          1.4. Representation of Electron Density Distribution

              The total electron density distribution is a physical property of molecules. It can
          be approached experimentally by a number of methods. Electron density of solids can
          be derived from X-ray crystallographic data. 76  However, specialized high-precision
          measurements are needed to obtain information that is relevant to understanding
          chemical reactivity. Gas phase electron diffraction can also provide electron density
          data. 77  The electron density is usually depicted as a comparison of the observed
          electron density with that predicted by spherical models of the atoms and is called
          deformation electron density. For example, Figure 1.24 is the result of a high-precision
          determination of the electron density in the plane of the benzene ring. 78  It shows an
          accumulation of electron density in the region between adjacent atoms and depletion
          of electron density in the center and immediately outside of the ring. Figure 1.25

           75   I. A. Koppel, P. Burk, I. Koppel, I. Leito, T. Sonoda, and M. Mishima, J. Am. Chem. Soc., 122, 5114
             (2000).
           76
             P. Coppens, X-ray Charge Densities and Chemical Bonding, Oxford University Press, Oxford, 1997.
           77   S. Shibata and F. Hirota, in Stereochemical Applications of Gas-Phase Electron Diffraction, I. Hargittai
             and M. Hargittai, eds., VCH Publishers, New York, 1988, Chap. 4.
           78
             H.-B. Burgi, S. C. Capelli, A. E. Goeta, J. A. K. Howard, M. A. Sparkman, and D. S. Yufit, Chem.
             Eur. J., 8, 3512 (2002).