
Page 86 - Advanced Organic Chemistry Part A - Structure and Mechanisms, 5th ed (2007) - Carey _ Sundberg
P. 86
65
SECTION 1.4
Representation of
Electron Density
Distribution
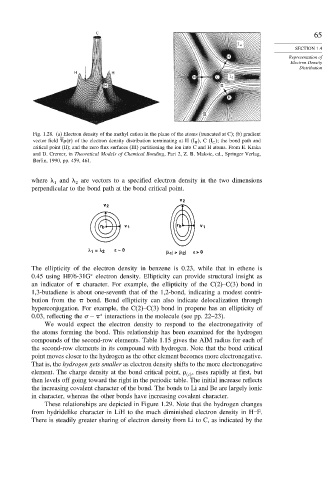
Fig. 1.28. (a) Electron density of the methyl cation in the plane of the atoms (truncated at C); (b) gradient
vector field ! r of the electron density distribution terminating at H I H ,C I C ; the bond path and
critical point (II); and the zero flux surfaces (III) partitioning the ion into C and H atoms. From E. Kraka
and D. Cremer, in Theoretical Models of Chemical Bonding, Part 2, Z. B. Maksic, ed., Springer Verlag,
Berlin, 1990, pp. 459, 461.
where ' and ' are vectors to a specified electron density in the two dimensions
2
1
perpendicular to the bond path at the bond critical point.
The ellipticity of the electron density in benzene is 0.23, while that in ethene is
0.45 using HF/6-31G electron density. Ellipticity can provide structural insight as
∗
an indicator of character. For example, the ellipticity of the C(2)–C(3) bond in
1,3-butadiene is about one-seventh that of the 1,2-bond, indicating a modest contri-
bution from the bond. Bond ellipticity can also indicate delocalization through
hyperconjugation. For example, the C(2)–C(3) bond in propene has an ellipticity of
0.03, reflecting the − interactions in the molecule (see pp. 22–23).
∗
We would expect the electron density to respond to the electronegativity of
the atoms forming the bond. This relationship has been examined for the hydrogen
compounds of the second-row elements. Table 1.15 gives the AIM radius for each of
the second-row elements in its compound with hydrogen. Note that the bond critical
point moves closer to the hydrogen as the other element becomes more electronegative.
That is, the hydrogen gets smaller as electron density shifts to the more electronegative
element. The charge density at the bond critical point, , rises rapidly at first, but
c
then levels off going toward the right in the periodic table. The initial increase reflects
the increasing covalent character of the bond. The bonds to Li and Be are largely ionic
in character, whereas the other bonds have increasing covalent character.
These relationships are depicted in Figure 1.29. Note that the hydrogen changes
from hydridelike character in LiH to the much diminished electron density in H–F.
There is steadily greater sharing of electron density from Li to C, as indicated by the