
Page 94 - Advanced Organic Chemistry Part A - Structure and Mechanisms, 5th ed (2007) - Carey _ Sundberg
P. 94
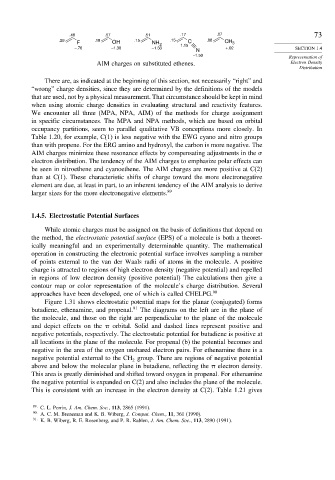
.48        .57        .51        .17        .07                          73
                   .29       .18         .15        .15  C     .08  CH
                        F          OH          NH 2                    3
                       –.76       –1.30        –1.33   1.15          +.02                 SECTION 1.4
                                                            N
                                                           –1.50
                                                                                        Representation of
                              AIM charges on substituted ethenes.                       Electron Density
                                                                                           Distribution
              There are, as indicated at the beginning of this section, not necessarily “right” and
          “wrong” charge densities, since they are determined by the definitions of the models
          that are used, not by a physical measurement. That circumstance should be kept in mind
          when using atomic charge densities in evaluating structural and reactivity features.
          We encounter all three (MPA, NPA, AIM) of the methods for charge assignment
          in specific circumstances. The MPA and NPA methods, which are based on orbital
          occupancy partitions, seem to parallel qualitative VB conceptions more closely. In
          Table 1.20, for example, C(1) is less negative with the EWG cyano and nitro groups
          than with propene. For the ERG amino and hydroxyl, the carbon is more negative. The
          AIM charges minimize these resonance effects by compensating adjustments in the
          electron distribution. The tendency of the AIM charges to emphasize polar effects can
          be seen in nitroethene and cyanoethene. The AIM charges are more positive at C(2)
          than at C(1). These characteristic shifts of charge toward the more electronegative
          element are due, at least in part, to an inherent tendency of the AIM analysis to derive
          larger sizes for the more electronegative elements. 89


          1.4.5. Electrostatic Potential Surfaces

              While atomic charges must be assigned on the basis of definitions that depend on
          the method, the electrostatic potential surface (EPS) of a molecule is both a theoret-
          ically meaningful and an experimentally determinable quantity. The mathematical
          operation in constructing the electronic potential surface involves sampling a number
          of points external to the van der Waals radii of atoms in the molecule. A positive
          charge is attracted to regions of high electron density (negative potential) and repelled
          in regions of low electron density (positive potential) The calculations then give a
          contour map or color representation of the molecule’s charge distribution. Several
          approaches have been developed, one of which is called CHELPG. 90
              Figure 1.31 shows electrostatic potential maps for the planar (conjugated) forms
          butadiene, ethenamine, and propenal. 91  The diagrams on the left are in the plane of
          the molecule, and those on the right are perpendicular to the plane of the molecule
          and depict effects on the   orbital. Solid and dashed lines represent positive and
          negative potentials, respectively. The electrostatic potential for butadiene is positive at
          all locations in the plane of the molecule. For propenal (b) the potential becomes and
          negative in the area of the oxygen unshared electron pairs. For ethenamine there is a
          negative potential external to the CH group. There are regions of negative potential
                                         2
          above and below the molecular plane in butadiene, reflecting the   electron density.
          This area is greatly diminished and shifted toward oxygen in propenal. For ethenamine
          the negative potential is expanded on C(2) and also includes the plane of the molecule.
          This is consistent with an increase in the electron density at C(2). Table 1.21 gives

           89
             C. L. Perrin, J. Am. Chem. Soc., 113, 2865 (1991).
           90   A. C. M. Breneman and K. B. Wiberg, J. Comput. Chem., 11, 361 (1990).
           91
             K. B. Wiberg, R. E. Rosenberg, and P. R. Rablen, J. Am. Chem. Soc., 113, 2890 (1991).